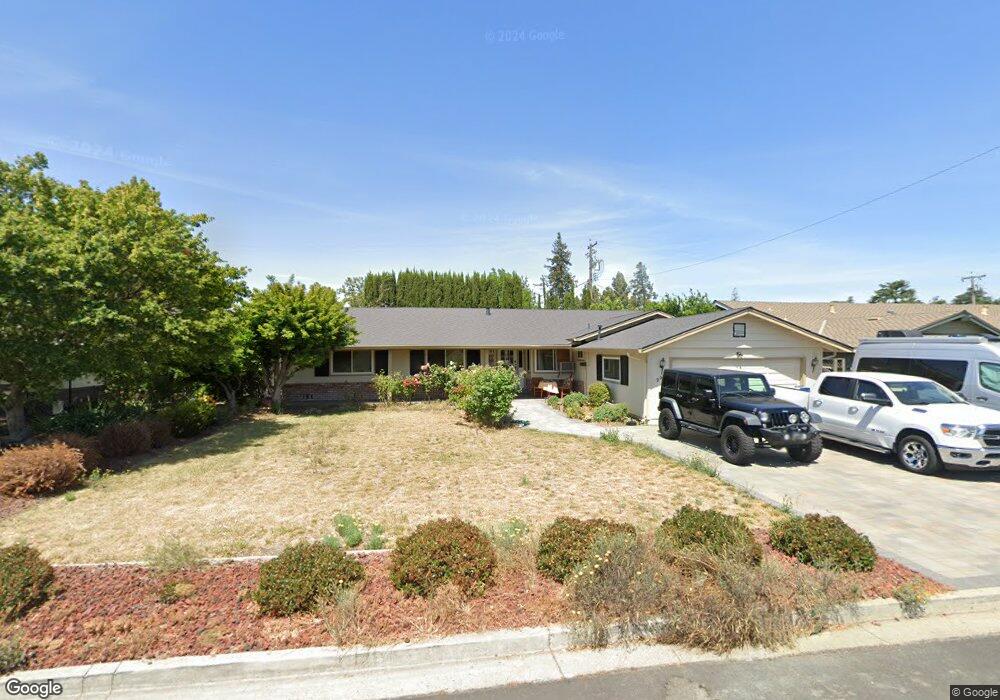
297 Moneta Way Campbell, CA 95008
Estimated Value: $2,242,524 - $2,544,000
4
Beds
3
Baths
1,840
Sq Ft
$1,289/Sq Ft
Est. Value
About This Home
This home is located at 297 Moneta Way, Campbell, CA 95008 and is currently estimated at $2,372,631, approximately $1,289 per square foot. 297 Moneta Way is a home located in Santa Clara County with nearby schools including Bagby Elementary School, Branham High School, and Fammatre Elementary School.
Ownership History
Date
Name
Owned For
Owner Type
Purchase Details
Closed on
Aug 17, 2016
Sold by
Ellis David Alian and Ellis Carol Ann
Bought by
Ellis David A and Ellis Carol A
Current Estimated Value
Home Financials for this Owner
Home Financials are based on the most recent Mortgage that was taken out on this home.
Original Mortgage
$538,000
Interest Rate
3.42%
Mortgage Type
New Conventional
Purchase Details
Closed on
Apr 25, 2007
Sold by
Ellis David A and Ellis Carol A
Bought by
Ellis David A and Ellis Carol A
Purchase Details
Closed on
Jul 7, 2005
Sold by
Ellis David A and Ellis Carol A
Bought by
Ellis David A and Ellis Carol A
Home Financials for this Owner
Home Financials are based on the most recent Mortgage that was taken out on this home.
Original Mortgage
$100,000
Interest Rate
5.51%
Mortgage Type
Credit Line Revolving
Purchase Details
Closed on
Jan 29, 2003
Sold by
Ellis David A and Ellis Carol A
Bought by
Ellis David A and Ellis Carol A
Create a Home Valuation Report for This Property
The Home Valuation Report is an in-depth analysis detailing your home's value as well as a comparison with similar homes in the area
Home Values in the Area
Average Home Value in this Area
Purchase History
| Date | Buyer | Sale Price | Title Company |
|---|---|---|---|
| Ellis David A | -- | Accommodation | |
| Ellis David Allan | -- | Chicago Title Company | |
| Ellis David A | -- | None Available | |
| Ellis David A | -- | Chicago Title | |
| Ellis David A | -- | -- |
Source: Public Records
Mortgage History
| Date | Status | Borrower | Loan Amount |
|---|---|---|---|
| Closed | Ellis David Allan | $538,000 | |
| Closed | Ellis David A | $100,000 |
Source: Public Records
Tax History Compared to Growth
Tax History
| Year | Tax Paid | Tax Assessment Tax Assessment Total Assessment is a certain percentage of the fair market value that is determined by local assessors to be the total taxable value of land and additions on the property. | Land | Improvement |
|---|---|---|---|---|
| 2025 | $7,031 | $504,811 | $172,252 | $332,559 |
| 2024 | $7,031 | $494,914 | $168,875 | $326,039 |
| 2023 | $7,014 | $485,211 | $165,564 | $319,647 |
| 2022 | $6,910 | $475,698 | $162,318 | $313,380 |
| 2021 | $6,762 | $466,372 | $159,136 | $307,236 |
| 2020 | $6,452 | $461,591 | $157,505 | $304,086 |
| 2019 | $6,350 | $452,541 | $154,417 | $298,124 |
| 2018 | $6,148 | $443,669 | $151,390 | $292,279 |
| 2017 | $5,972 | $434,971 | $148,422 | $286,549 |
| 2016 | $5,658 | $426,443 | $145,512 | $280,931 |
| 2015 | $5,639 | $420,039 | $143,327 | $276,712 |
| 2014 | $5,470 | $411,812 | $140,520 | $271,292 |
Source: Public Records
Map
Nearby Homes
- 1110 Cameo Dr
- 866 Apricot Ave Unit C
- 382 Union Ave Unit C
- 70 Union Place
- 521 Union Ave
- 515 Union Ave
- 185 Union Ave Unit 16
- 185 Union Ave Unit 75
- 722 Duncanville Ct
- 1959 Schrader Dr
- 1500 E Campbell Ave
- 88 La Paz Way Unit 88
- 912 Campisi Way Unit 115
- 912 Campisi Way Unit 201
- 701 Sweetbriar Dr
- 665 Hawthorne Ave
- 68 Page St
- 2538 Custer Dr
- 1829 Cabana Dr
- 178 Salmar Terrace
- 285 Moneta Way
- 323 Moneta Way
- 325 Moneta Way
- 273 Moneta Way
- 1082 Cameo Dr
- 272 Moneta Way
- 259 Moneta Way
- 329 Moneta Way
- 2230 S Bascom Ave
- 1083 Arnott Way
- 1096 Cameo Dr
- 1097 Cameo Dr
- 1082 Bent Dr
- 245 Moneta Way
- 1097 Arnott Way
- 331 Moneta Way
- 1096 Bent Dr
- 1111 Cameo Dr
- 1082 Arnott Way
- 2210 S Bascom Ave