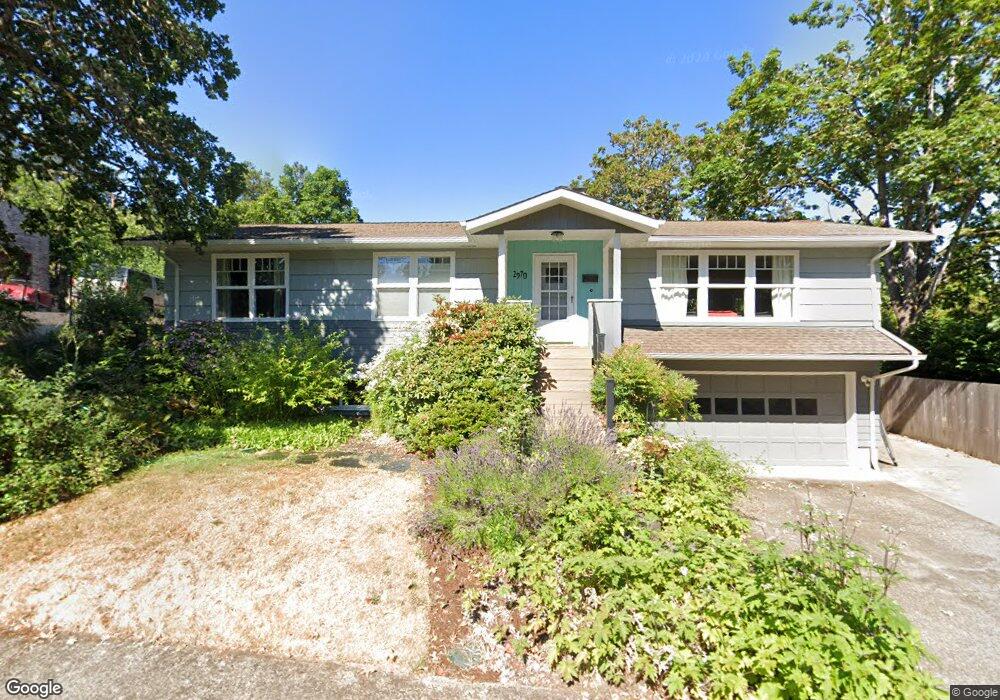
2970 Charnelton St Eugene, OR 97405
Crest Drive NeighborhoodEstimated Value: $607,000 - $750,000
4
Beds
3
Baths
2,470
Sq Ft
$262/Sq Ft
Est. Value
About This Home
This home is located at 2970 Charnelton St, Eugene, OR 97405 and is currently estimated at $647,909, approximately $262 per square foot. 2970 Charnelton St is a home located in Lane County with nearby schools including Adams Elementary School, Roosevelt Middle School, and South Eugene High School.
Ownership History
Date
Name
Owned For
Owner Type
Purchase Details
Closed on
Nov 23, 2010
Sold by
Parisi Jeannine
Bought by
Parisi Jeannine and Mcdonald Mercy A
Current Estimated Value
Home Financials for this Owner
Home Financials are based on the most recent Mortgage that was taken out on this home.
Original Mortgage
$218,000
Interest Rate
4.16%
Mortgage Type
New Conventional
Purchase Details
Closed on
Jul 22, 2005
Sold by
Thompson Paul
Bought by
Parisi Jeannine
Home Financials for this Owner
Home Financials are based on the most recent Mortgage that was taken out on this home.
Original Mortgage
$231,400
Interest Rate
5.56%
Mortgage Type
Fannie Mae Freddie Mac
Purchase Details
Closed on
Apr 28, 2003
Sold by
Andreason Forrest F and Andreason Rosella
Bought by
Parisi Jeannine and Thompson Paul
Home Financials for this Owner
Home Financials are based on the most recent Mortgage that was taken out on this home.
Original Mortgage
$156,000
Interest Rate
5.84%
Create a Home Valuation Report for This Property
The Home Valuation Report is an in-depth analysis detailing your home's value as well as a comparison with similar homes in the area
Home Values in the Area
Average Home Value in this Area
Purchase History
| Date | Buyer | Sale Price | Title Company |
|---|---|---|---|
| Parisi Jeannine | -- | Fidelity National Title Insu | |
| Parisi Jeannine | $27,500 | Western Title & Escrow Compa | |
| Parisi Jeannine | $195,000 | Western Pioneer Title Co |
Source: Public Records
Mortgage History
| Date | Status | Borrower | Loan Amount |
|---|---|---|---|
| Closed | Parisi Jeannine | $218,000 | |
| Closed | Parisi Jeannine | $231,400 | |
| Previous Owner | Parisi Jeannine | $156,000 | |
| Closed | Parisi Jeannine | $29,250 |
Source: Public Records
Tax History
| Year | Tax Paid | Tax Assessment Tax Assessment Total Assessment is a certain percentage of the fair market value that is determined by local assessors to be the total taxable value of land and additions on the property. | Land | Improvement |
|---|---|---|---|---|
| 2025 | $5,992 | $307,526 | -- | -- |
| 2024 | $5,917 | $298,569 | -- | -- |
| 2023 | $5,917 | $289,873 | $0 | $0 |
| 2022 | $5,543 | $281,431 | $0 | $0 |
| 2021 | $5,207 | $273,234 | $0 | $0 |
| 2020 | $5,225 | $265,276 | $0 | $0 |
| 2019 | $5,046 | $257,550 | $0 | $0 |
| 2018 | $4,750 | $242,766 | $0 | $0 |
| 2017 | $4,537 | $242,766 | $0 | $0 |
| 2016 | $4,425 | $235,695 | $0 | $0 |
| 2015 | $4,298 | $228,830 | $0 | $0 |
| 2014 | $4,211 | $222,165 | $0 | $0 |
Source: Public Records
Map
Nearby Homes
- 2965 Olive St
- 84 W 27th Ave
- 310 1/2 E 31st Ave Unit 1
- 0 Hidden Meadows
- 605 Fulvue Dr
- 865 W 28th Ave
- 1 Storey Blvd
- 2 Storey Blvd
- 3593 Lawrence St
- 3160 Whitten Dr
- 357 W 37th Ave
- 3023 Hummingbird Ln
- 870 W 25th Ave
- 3031 Hummingbird Ln
- 951 W 27th Ave
- 453 Dellwood Dr
- 3087 Whitbeck Blvd
- 2815 Hilyard St
- 555 Stafford Ct
- 790 E 32nd Ave
- 2960 Charnelton St
- 235 W 30th Ave
- 2975 Lincoln St
- 2985 Lincoln St
- 2965 Lincoln St
- 2995 Lincoln St
- 2985 Charnelton St
- 2975 Charnelton St
- 2945 Lincoln St
- 2940 Charnelton St
- 2995 Charnelton St
- 2965 Charnelton St
- 2935 Lincoln St
- 3010 Charnelton St
- 250 W 30th Ave
- 2930 Charnelton St
- 2974 Lincoln St
- 2964 Lincoln St
- 125 W 30th Ave
- 280 W 30th Ave
Your Personal Tour Guide
Ask me questions while you tour the home.