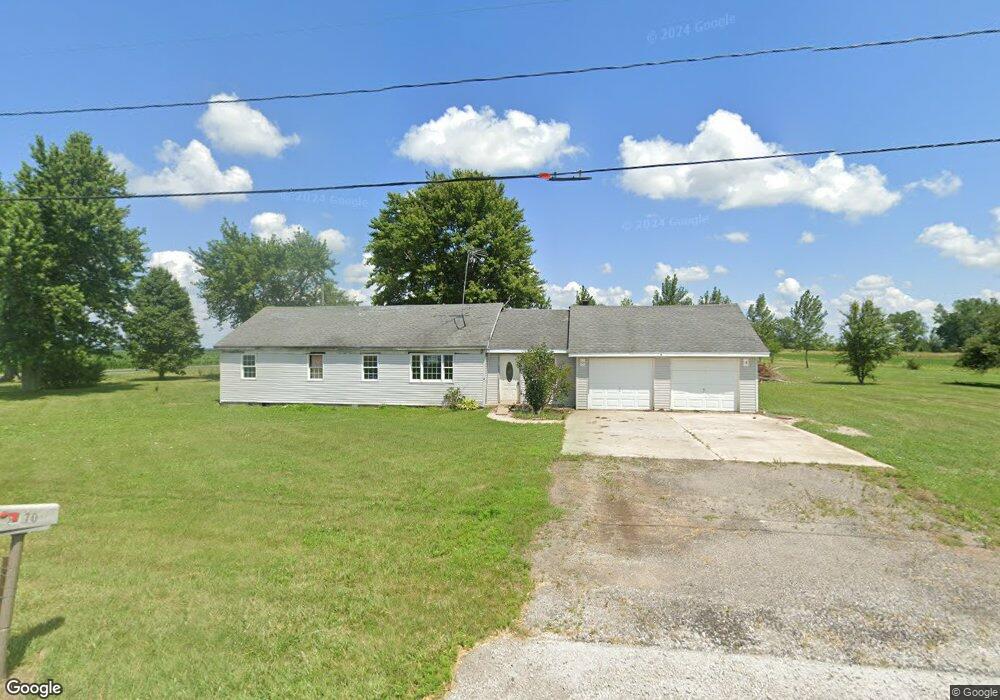
2970 Otsego Pike Custar, OH 43511
Estimated Value: $46,870 - $198,000
3
Beds
2
Baths
2,026
Sq Ft
$65/Sq Ft
Est. Value
About This Home
This home is located at 2970 Otsego Pike, Custar, OH 43511 and is currently estimated at $132,468, approximately $65 per square foot. 2970 Otsego Pike is a home located in Wood County with nearby schools including McComb Elementary School, McComb Middle School, and Mccomb Local High School.
Ownership History
Date
Name
Owned For
Owner Type
Purchase Details
Closed on
Jan 22, 2024
Sold by
Canales Dianna L A
Bought by
National Homes Llc
Current Estimated Value
Purchase Details
Closed on
Sep 21, 2016
Sold by
Smith John A
Bought by
Canales Dianna L A
Purchase Details
Closed on
May 4, 2012
Sold by
Us Bank Na Nd
Bought by
Smith John A
Purchase Details
Closed on
Nov 29, 2011
Sold by
Garrard Michelle and Gerrard Michelle Suzanne
Bought by
Us Bank Na Nd
Purchase Details
Closed on
Nov 2, 1998
Sold by
Va
Bought by
Garrard David and Garrard Michelle
Home Financials for this Owner
Home Financials are based on the most recent Mortgage that was taken out on this home.
Original Mortgage
$35,700
Interest Rate
6.72%
Purchase Details
Closed on
Oct 13, 1992
Bought by
Schwab Dale L
Create a Home Valuation Report for This Property
The Home Valuation Report is an in-depth analysis detailing your home's value as well as a comparison with similar homes in the area
Home Values in the Area
Average Home Value in this Area
Purchase History
| Date | Buyer | Sale Price | Title Company |
|---|---|---|---|
| National Homes Llc | $22,500 | None Listed On Document | |
| Canales Dianna L A | $15,000 | None Available | |
| Smith John A | $9,000 | Attorney | |
| Us Bank Na Nd | $40,000 | Attorney | |
| Garrard David | -- | -- | |
| Schwab Dale L | $54,000 | -- |
Source: Public Records
Mortgage History
| Date | Status | Borrower | Loan Amount |
|---|---|---|---|
| Previous Owner | Garrard David | $35,700 |
Source: Public Records
Tax History Compared to Growth
Tax History
| Year | Tax Paid | Tax Assessment Tax Assessment Total Assessment is a certain percentage of the fair market value that is determined by local assessors to be the total taxable value of land and additions on the property. | Land | Improvement |
|---|---|---|---|---|
| 2024 | $1,815 | $31,745 | $9,975 | $21,770 |
| 2023 | $1,815 | $31,750 | $9,980 | $21,770 |
| 2021 | $1,337 | $27,200 | $8,050 | $19,150 |
| 2020 | $1,347 | $27,200 | $8,050 | $19,150 |
| 2019 | $1,300 | $26,990 | $7,840 | $19,150 |
| 2018 | $1,271 | $26,990 | $7,840 | $19,150 |
| 2017 | $1,366 | $26,990 | $7,840 | $19,150 |
| 2016 | $1,343 | $25,550 | $6,860 | $18,690 |
| 2015 | $1,321 | $25,550 | $6,860 | $18,690 |
| 2014 | $1,196 | $25,550 | $6,860 | $18,690 |
| 2013 | $1,196 | $23,210 | $6,230 | $16,980 |
Source: Public Records
Map
Nearby Homes
- 0 N Maple St
- 687 State Route 235
- 20236 Jerry City Rd
- 1381 County Road 5
- 4134 County Road 203
- 508 W Walnut St
- 318 Belmont St
- D273 Co Rd 1
- 300 W Water St
- 233 & 235 N Main St
- 1403 County Road D
- 216 S Tarr St
- 227 E Broadway St
- 112 N Beecher St
- 508 E Water St
- 223 Cherry St
- 139 S Lind St
- 207 N Todd St
- 128 Zihlman St
- 109 Smith St