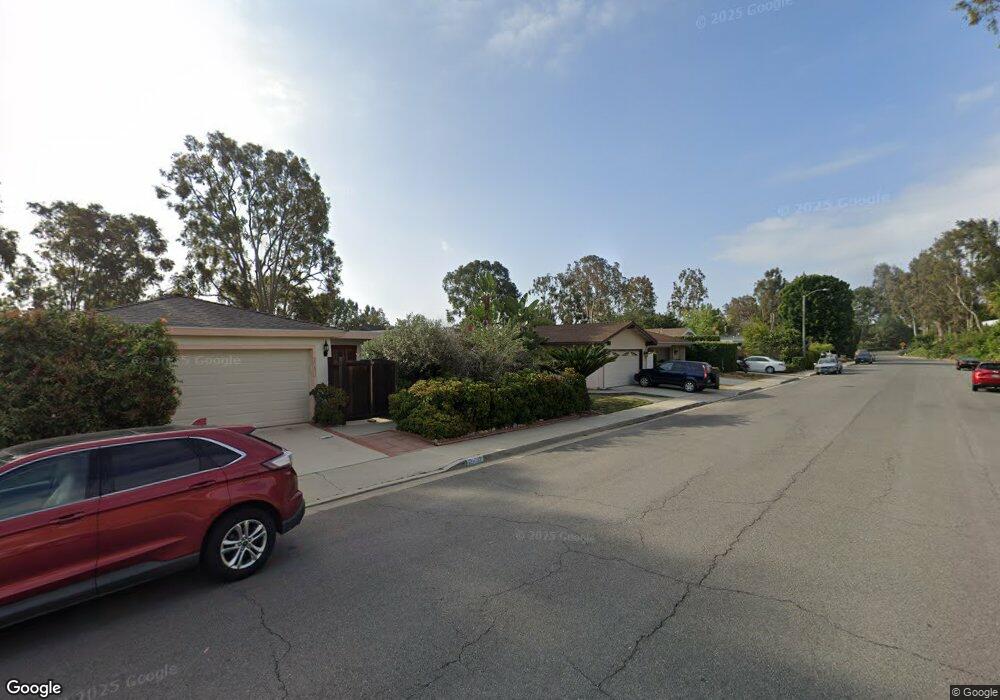
29702 Felton Dr Laguna Niguel, CA 92677
Crown Valley Highlands NeighborhoodEstimated Value: $1,395,460 - $1,548,000
3
Beds
2
Baths
1,901
Sq Ft
$771/Sq Ft
Est. Value
About This Home
This home is located at 29702 Felton Dr, Laguna Niguel, CA 92677 and is currently estimated at $1,465,365, approximately $770 per square foot. 29702 Felton Dr is a home located in Orange County with nearby schools including Moulton Elementary, Niguel Hills Middle School, and Dana Hills High School.
Ownership History
Date
Name
Owned For
Owner Type
Purchase Details
Closed on
Jun 19, 2020
Sold by
Palomino Rosalie E
Bought by
Palomino Rosalie E and The Rosalie E Palomino Trust
Current Estimated Value
Purchase Details
Closed on
Dec 11, 2008
Sold by
Rosecrans Geoff S
Bought by
Palomino Rosalie E
Purchase Details
Closed on
Aug 26, 2002
Sold by
Mankin Kurt and Mankin Lisa
Bought by
Rosecrans Geoff S
Home Financials for this Owner
Home Financials are based on the most recent Mortgage that was taken out on this home.
Original Mortgage
$435,565
Interest Rate
6.17%
Purchase Details
Closed on
Aug 6, 1999
Sold by
Cheung Neil H
Bought by
Mankin Kurt and Mankin Lisa
Home Financials for this Owner
Home Financials are based on the most recent Mortgage that was taken out on this home.
Original Mortgage
$224,000
Interest Rate
7.5%
Create a Home Valuation Report for This Property
The Home Valuation Report is an in-depth analysis detailing your home's value as well as a comparison with similar homes in the area
Home Values in the Area
Average Home Value in this Area
Purchase History
| Date | Buyer | Sale Price | Title Company |
|---|---|---|---|
| Palomino Rosalie E | -- | None Available | |
| Palomino Rosalie E | $482,000 | Lawyers Title Co | |
| Rosecrans Geoff S | $484,500 | Old Republic Title Company | |
| Mankin Kurt | $280,000 | Fidelity National Title Ins |
Source: Public Records
Mortgage History
| Date | Status | Borrower | Loan Amount |
|---|---|---|---|
| Previous Owner | Rosecrans Geoff S | $435,565 | |
| Previous Owner | Mankin Kurt | $224,000 |
Source: Public Records
Tax History Compared to Growth
Tax History
| Year | Tax Paid | Tax Assessment Tax Assessment Total Assessment is a certain percentage of the fair market value that is determined by local assessors to be the total taxable value of land and additions on the property. | Land | Improvement |
|---|---|---|---|---|
| 2025 | $6,105 | $620,692 | $468,942 | $151,750 |
| 2024 | $6,105 | $608,522 | $459,747 | $148,775 |
| 2023 | $5,974 | $596,591 | $450,733 | $145,858 |
| 2022 | $5,859 | $584,894 | $441,895 | $142,999 |
| 2021 | $5,745 | $573,426 | $433,230 | $140,196 |
| 2020 | $5,687 | $567,547 | $428,788 | $138,759 |
| 2019 | $5,574 | $556,419 | $420,380 | $136,039 |
| 2018 | $5,466 | $545,509 | $412,137 | $133,372 |
| 2017 | $5,358 | $534,813 | $404,056 | $130,757 |
| 2016 | $5,254 | $524,327 | $396,133 | $128,194 |
| 2015 | $5,173 | $516,452 | $390,183 | $126,269 |
| 2014 | $5,073 | $506,336 | $382,540 | $123,796 |
Source: Public Records
Map
Nearby Homes
- 29712 Ellendale Dr
- 23231 Cheswald Dr
- 29931 Happy Sparrow Ln
- 29494 Port Royal Way
- 29452 Port Royal Way
- 29981 Running Deer Ln
- 29522 Seriana
- 29411 Port Royal Way
- 29422 Christiana Way
- 29405 Christiana Way
- 23653 Lexington Ct Unit 2
- 30052 Happy Sparrow Ln
- 23706 Sea Breeze Ln Unit 1
- 23728 Sea Breeze Ln Unit 14
- 7 Sierra Vista
- 29312 Kensington Dr
- 29242 Elba Dr
- 50 Vista Montemar
- 29254 Alfieri St
- 30256 Via Reata
- 29712 Felton Dr
- 29692 Felton Dr
- 29722 Felton Dr
- 29682 Felton Dr
- 29726 Felton Dr
- 29672 Felton Dr
- 29702 Ellendale Dr
- 29692 Ellendale Dr
- 29732 Felton Dr
- 29682 Ellendale Dr
- 29662 Felton Dr
- 29722 Ellendale Dr
- 29672 Ellendale Dr
- 29742 Felton Dr
- 29726 Ellendale Dr
- 29662 Ellendale Dr
- 29652 Felton Dr
- 29732 Ellendale Dr
- 29652 Ellendale Dr
- 29752 Felton Dr