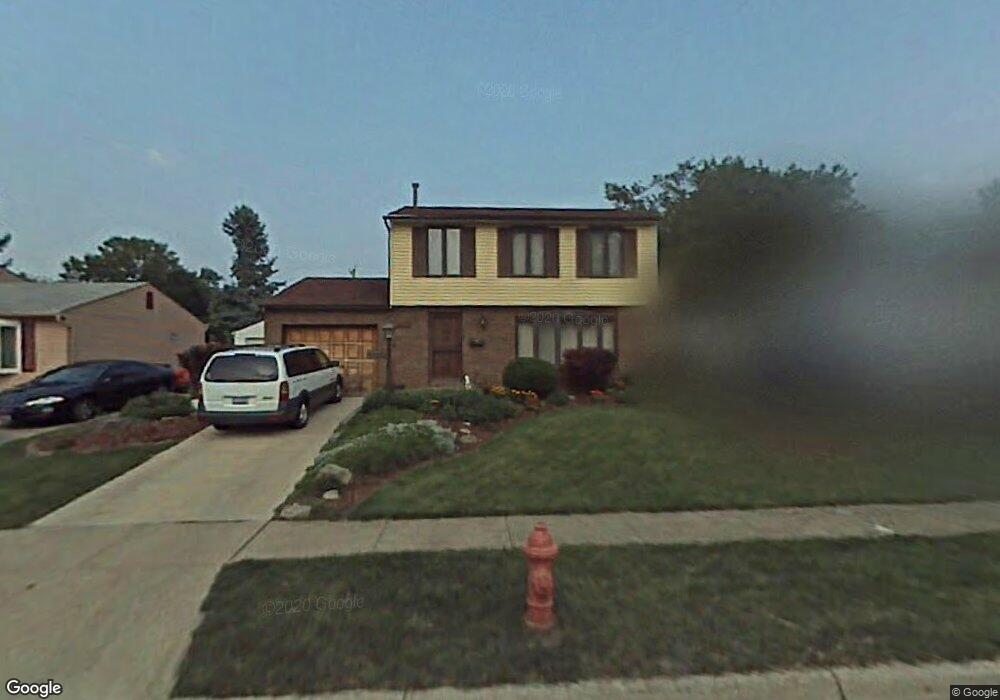
2972 Renfro Rd Columbus, OH 43232
East Columbus-White Ash NeighborhoodEstimated Value: $226,000 - $254,609
3
Beds
2
Baths
1,608
Sq Ft
$150/Sq Ft
Est. Value
About This Home
This home is located at 2972 Renfro Rd, Columbus, OH 43232 and is currently estimated at $240,652, approximately $149 per square foot. 2972 Renfro Rd is a home located in Franklin County with nearby schools including Groveport Madison High School, A+ Arts Academy, and Eastland Preparatory Academy.
Ownership History
Date
Name
Owned For
Owner Type
Purchase Details
Closed on
May 28, 2010
Sold by
Thoman Troy W and Thoman Donna M
Bought by
Howard Frances Elizabeth
Current Estimated Value
Home Financials for this Owner
Home Financials are based on the most recent Mortgage that was taken out on this home.
Original Mortgage
$108,439
Outstanding Balance
$73,435
Interest Rate
5.5%
Mortgage Type
FHA
Estimated Equity
$167,217
Purchase Details
Closed on
Nov 30, 2000
Sold by
Schmid Robert H and Schmid Edith A
Bought by
Thoman Troy W and Thoman Donna M
Home Financials for this Owner
Home Financials are based on the most recent Mortgage that was taken out on this home.
Original Mortgage
$117,025
Interest Rate
7.7%
Mortgage Type
FHA
Purchase Details
Closed on
Jul 24, 1977
Bought by
Schmid Robert H
Create a Home Valuation Report for This Property
The Home Valuation Report is an in-depth analysis detailing your home's value as well as a comparison with similar homes in the area
Home Values in the Area
Average Home Value in this Area
Purchase History
| Date | Buyer | Sale Price | Title Company |
|---|---|---|---|
| Howard Frances Elizabeth | $109,900 | Chicago Tit | |
| Thoman Troy W | $118,000 | Connor Title Co | |
| Schmid Robert H | -- | -- |
Source: Public Records
Mortgage History
| Date | Status | Borrower | Loan Amount |
|---|---|---|---|
| Open | Howard Frances Elizabeth | $108,439 | |
| Previous Owner | Thoman Troy W | $117,025 |
Source: Public Records
Tax History
| Year | Tax Paid | Tax Assessment Tax Assessment Total Assessment is a certain percentage of the fair market value that is determined by local assessors to be the total taxable value of land and additions on the property. | Land | Improvement |
|---|---|---|---|---|
| 2025 | $3,961 | $78,270 | $17,820 | $60,450 |
| 2024 | $3,961 | $78,270 | $17,820 | $60,450 |
| 2023 | $3,795 | $78,260 | $17,815 | $60,445 |
| 2022 | $2,670 | $43,160 | $6,300 | $36,860 |
| 2021 | $2,681 | $43,160 | $6,300 | $36,860 |
| 2020 | $2,717 | $43,160 | $6,300 | $36,860 |
| 2019 | $2,432 | $35,770 | $5,250 | $30,520 |
| 2018 | $2,361 | $35,770 | $5,250 | $30,520 |
| 2017 | $2,452 | $35,770 | $5,250 | $30,520 |
| 2016 | $2,332 | $30,840 | $4,340 | $26,500 |
| 2015 | $2,276 | $30,840 | $4,340 | $26,500 |
| 2014 | $2,298 | $30,840 | $4,340 | $26,500 |
| 2013 | $1,093 | $34,265 | $4,830 | $29,435 |
Source: Public Records
Map
Nearby Homes
- 2932 Renfro Rd
- 5143 Rutledge Dr N
- 4942 Talbert Dr
- 2998 Osgood Rd E
- 5290 Quincy Dr
- 5323 Sundale Place S
- 5361 Parkline Dr
- 4878 Amber Crossing Dr
- 5373 Spire Ln
- 5422 Everson Rd N
- 5137 Holbrook Dr
- 3246 Latonia Rd
- 3275 Faycrest Rd
- 2900 Gentry Ln
- 3302 Everson Rd E
- 3333 Latonia Ct
- 5414 Paladim Rd
- 5326 Adderley Ave
- 5278 Glenbriar Ct
- 2336 Noe Bixby Rd
- 2964 Renfro Rd
- 2980 Renfro Rd
- 2979 Olivette Rd
- 2988 Renfro Rd
- 2987 Olivette Rd
- 2973 Olivette Rd
- 2965 Olivette Rd
- 5093 Silverton Dr
- 2995 Olivette Rd
- 5029 Silverton Dr
- 5029 Silverton Dr
- 2985 Renfro Rd
- 5085 Silverton Dr
- 5077 Silverton Dr
- 2959 Olivette Rd
- 5069 Silverton Dr
- 2940 Renfro Rd
- 2999 Renfro Rd
- 5061 Silverton Dr
Your Personal Tour Guide
Ask me questions while you tour the home.