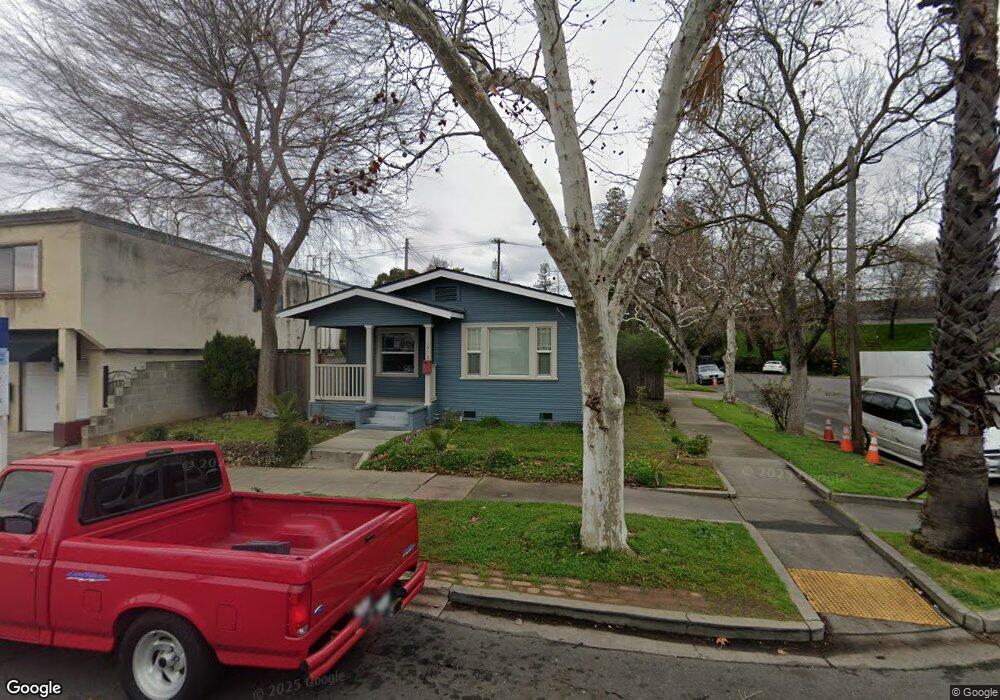
2973 3rd Ave Sacramento, CA 95817
Curtis Park NeighborhoodEstimated Value: $397,000 - $457,190
2
Beds
1
Bath
1,044
Sq Ft
$408/Sq Ft
Est. Value
About This Home
This home is located at 2973 3rd Ave, Sacramento, CA 95817 and is currently estimated at $426,298, approximately $408 per square foot. 2973 3rd Ave is a home located in Sacramento County with nearby schools including Bret Harte Elementary School, California Middle, and C. K. McClatchy High.
Ownership History
Date
Name
Owned For
Owner Type
Purchase Details
Closed on
Mar 21, 2024
Sold by
Archie Lee and Archie Hanju
Bought by
Archie
Current Estimated Value
Purchase Details
Closed on
Jul 6, 2022
Sold by
Sukraw Lee R
Bought by
Archie Lee and Archie Han Ju
Home Financials for this Owner
Home Financials are based on the most recent Mortgage that was taken out on this home.
Original Mortgage
$388,250
Interest Rate
5.1%
Mortgage Type
Seller Take Back
Purchase Details
Closed on
Mar 17, 2014
Sold by
Senechal Brett
Bought by
Sukraw Lee R
Purchase Details
Closed on
Jul 9, 1999
Sold by
Baldwin Madison Kevin and Baldwin Kristi
Bought by
Senechal Brett
Home Financials for this Owner
Home Financials are based on the most recent Mortgage that was taken out on this home.
Original Mortgage
$91,359
Interest Rate
7.4%
Mortgage Type
FHA
Create a Home Valuation Report for This Property
The Home Valuation Report is an in-depth analysis detailing your home's value as well as a comparison with similar homes in the area
Home Values in the Area
Average Home Value in this Area
Purchase History
| Date | Buyer | Sale Price | Title Company |
|---|---|---|---|
| Archie | -- | None Listed On Document | |
| Archie | -- | None Listed On Document | |
| Archie Lee | $388,500 | Chicago Title | |
| Sukraw Lee R | $209,000 | Chicago Title Company | |
| Senechal Brett | $91,500 | Chicago Title Co |
Source: Public Records
Mortgage History
| Date | Status | Borrower | Loan Amount |
|---|---|---|---|
| Previous Owner | Archie Lee | $388,250 | |
| Previous Owner | Senechal Brett | $91,359 |
Source: Public Records
Tax History Compared to Growth
Tax History
| Year | Tax Paid | Tax Assessment Tax Assessment Total Assessment is a certain percentage of the fair market value that is determined by local assessors to be the total taxable value of land and additions on the property. | Land | Improvement |
|---|---|---|---|---|
| 2025 | $4,746 | $403,935 | $182,070 | $221,865 |
| 2024 | $4,746 | $396,015 | $178,500 | $217,515 |
| 2023 | $6,490 | $550,000 | $250,000 | $300,000 |
| 2022 | $2,955 | $241,421 | $202,149 | $39,272 |
| 2021 | $2,817 | $236,688 | $198,186 | $38,502 |
| 2020 | $2,839 | $234,262 | $196,154 | $38,108 |
| 2019 | $2,779 | $229,669 | $192,308 | $37,361 |
| 2018 | $2,707 | $225,167 | $188,538 | $36,629 |
| 2017 | $2,670 | $220,753 | $184,842 | $35,911 |
| 2016 | $2,582 | $216,425 | $181,218 | $35,207 |
| 2015 | $2,544 | $213,175 | $178,496 | $34,679 |
| 2014 | $1,329 | $114,707 | $27,575 | $87,132 |
Source: Public Records
Map
Nearby Homes
- 2732 30th St
- 2725 Franklin Blvd
- 3001 3rd Ave
- 2724 30th St
- 3000 3rd Ave
- 2717 Franklin Blvd
- 2970 2nd Ave
- 2891 Castro Way
- 2906 Franklin Blvd
- 3008 3rd Ave
- 2890 Castro Way
- 2819 30th St
- 2716 Franklin Blvd
- 2881 Castro Way
- 2880 Castro Way
- 2708 Franklin Blvd
- 3rd Pansy Ave
- 2891 3rd Ave
- 2871 Castro Way
- 2700 Franklin Blvd