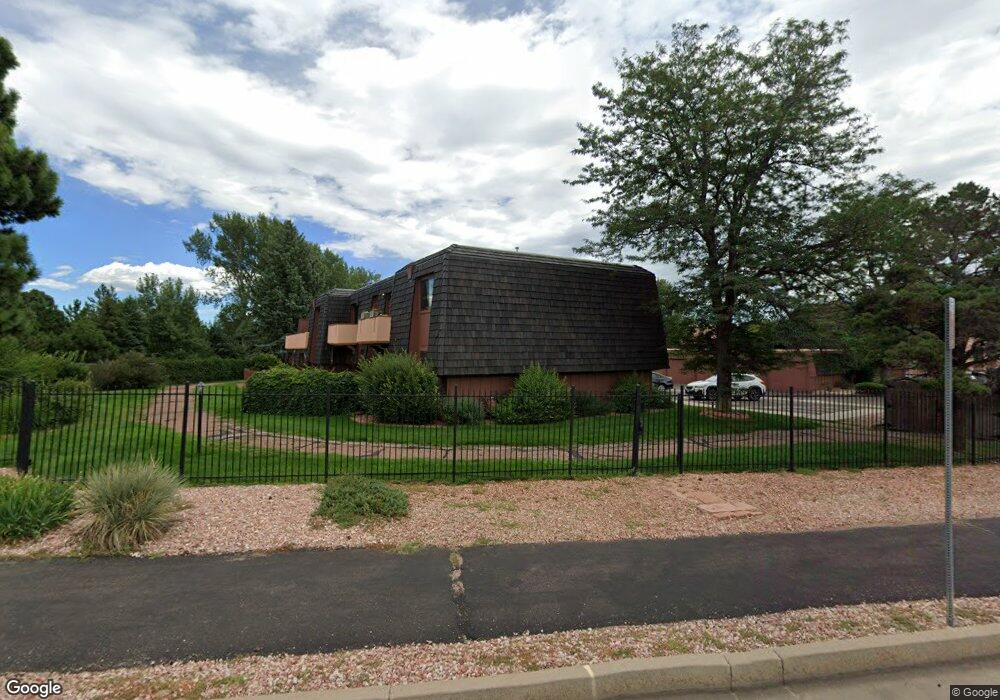
2973 Mesa Rd Unit A Colorado Springs, CO 80904
Kissing Camels NeighborhoodEstimated Value: $263,538 - $323,000
2
Beds
2
Baths
1,191
Sq Ft
$246/Sq Ft
Est. Value
About This Home
This home is located at 2973 Mesa Rd Unit A, Colorado Springs, CO 80904 and is currently estimated at $292,885, approximately $245 per square foot. 2973 Mesa Rd Unit A is a home located in El Paso County with nearby schools including Howbert Elementary School, Holmes Middle School, and Coronado High School.
Ownership History
Date
Name
Owned For
Owner Type
Purchase Details
Closed on
Aug 14, 2018
Sold by
Clark Carrie and Bigley Kenney
Bought by
Bigley Kenney and Clark Carrie
Current Estimated Value
Home Financials for this Owner
Home Financials are based on the most recent Mortgage that was taken out on this home.
Original Mortgage
$50,000
Outstanding Balance
$37,132
Interest Rate
4.5%
Mortgage Type
Stand Alone Second
Estimated Equity
$255,753
Purchase Details
Closed on
May 16, 2012
Sold by
York Wanda D and Clark Karen C
Bought by
Clark Carrie
Home Financials for this Owner
Home Financials are based on the most recent Mortgage that was taken out on this home.
Original Mortgage
$112,084
Outstanding Balance
$77,109
Interest Rate
3.75%
Mortgage Type
FHA
Estimated Equity
$215,776
Purchase Details
Closed on
Sep 7, 1988
Bought by
Clark Carrie
Purchase Details
Closed on
Dec 23, 1971
Bought by
Clark Carrie
Create a Home Valuation Report for This Property
The Home Valuation Report is an in-depth analysis detailing your home's value as well as a comparison with similar homes in the area
Home Values in the Area
Average Home Value in this Area
Purchase History
| Date | Buyer | Sale Price | Title Company |
|---|---|---|---|
| Bigley Kenney | -- | None Available | |
| Clark Carrie | $115,000 | Stewart Title | |
| Clark Carrie | -- | -- | |
| Clark Carrie | -- | -- |
Source: Public Records
Mortgage History
| Date | Status | Borrower | Loan Amount |
|---|---|---|---|
| Open | Bigley Kenney | $50,000 | |
| Open | Clark Carrie | $112,084 |
Source: Public Records
Tax History Compared to Growth
Tax History
| Year | Tax Paid | Tax Assessment Tax Assessment Total Assessment is a certain percentage of the fair market value that is determined by local assessors to be the total taxable value of land and additions on the property. | Land | Improvement |
|---|---|---|---|---|
| 2025 | $800 | $18,580 | -- | -- |
| 2024 | $692 | $18,760 | $3,920 | $14,840 |
| 2022 | $793 | $14,180 | $2,780 | $11,400 |
| 2021 | $861 | $14,590 | $2,860 | $11,730 |
| 2020 | $899 | $13,240 | $2,070 | $11,170 |
| 2019 | $894 | $13,240 | $2,070 | $11,170 |
| 2018 | $839 | $11,440 | $1,660 | $9,780 |
| 2017 | $795 | $11,440 | $1,660 | $9,780 |
| 2016 | $642 | $11,080 | $1,670 | $9,410 |
| 2015 | $640 | $11,080 | $1,670 | $9,410 |
| 2014 | $630 | $10,470 | $1,510 | $8,960 |
Source: Public Records
Map
Nearby Homes
- 2905 Mesa Rd Unit D
- 3033 Cathedral Park View
- 3161 Sunnybrook Ln
- 3161 Sunnybrook Ln Unit LOT 1
- 1970 Hill Ln
- 2746 Cathedral Rock View
- 1532 Smoochers Cir
- 1122 Fontmore Rd Unit C
- 1130 Fontmore Rd Unit D
- 2756 Cramer Heights
- 2744 Cramer Heights
- 1006 Fontmore Rd Unit C
- 1006 Fontmore Rd Unit D
- 3220 Virga Loop
- Elm Plan at Preserve at Mesa Creek - The Celestial Collection
- Maple Plan at Preserve at Mesa Creek - The Celestial Collection
- Willow Plan at Preserve at Mesa Creek - The Celestial Collection
- Fir Plan at Preserve at Mesa Creek - The Celestial Collection
- Juniper Plan at Preserve at Mesa Creek - The Celestial Collection
- 5130 Lyda Ln
- 2973 Mesa Rd Unit B
- 2973 Mesa Rd Unit D
- 2973 Mesa Rd
- 2969 Mesa Rd Unit A
- 2969 Mesa Rd Unit B
- 2969 Mesa Rd Unit A
- 2963 Mesa Rd Unit A
- 2963 Mesa Rd Unit C
- 2963 Mesa Rd Unit D
- 1980 Inwood Cir
- 2979 Mesa Rd Unit D
- 2979 Mesa Rd Unit C
- 2979 Mesa Rd Unit A
- 2983 Mesa Rd Unit D
- 2983 Mesa Rd Unit B
- 2983 Mesa Rd Unit C
- 2983 Mesa Rd Unit A
- 2959 Mesa Rd Unit D
- 2959 Mesa Rd Unit C
- 2959 Mesa Rd