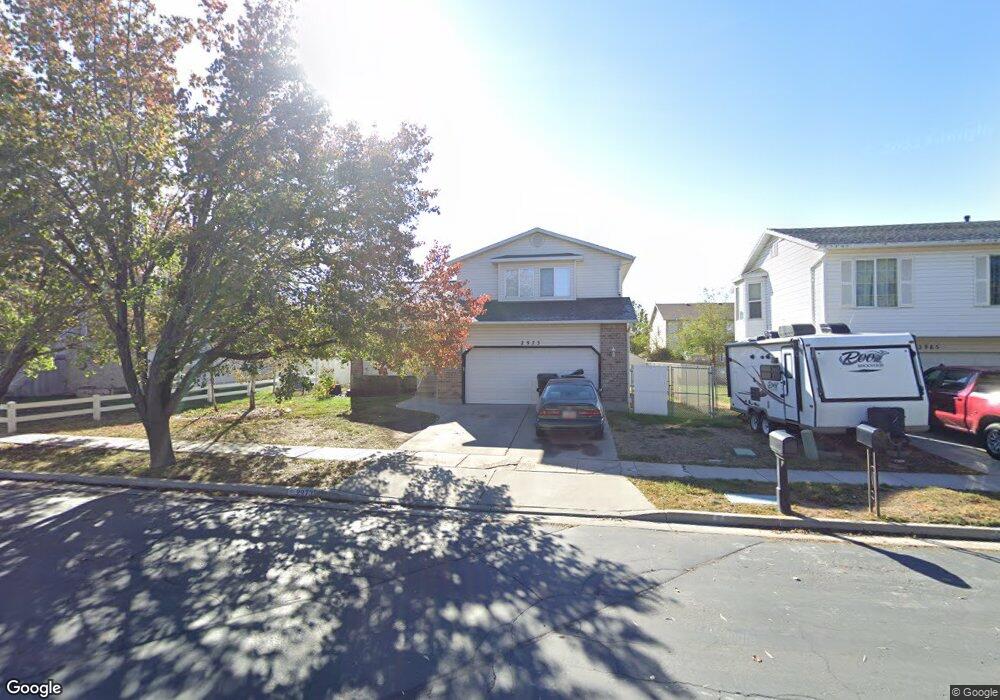
2973 W 2125 S Syracuse, UT 84075
Estimated Value: $468,000 - $582,000
5
Beds
4
Baths
2,128
Sq Ft
$241/Sq Ft
Est. Value
About This Home
This home is located at 2973 W 2125 S, Syracuse, UT 84075 and is currently estimated at $513,700, approximately $241 per square foot. 2973 W 2125 S is a home located in Davis County with nearby schools including Buffalo Point School, Syracuse Junior High School, and Syracuse High School.
Ownership History
Date
Name
Owned For
Owner Type
Purchase Details
Closed on
Jun 16, 2021
Sold by
Collett Diane and Collett Jonathan T
Bought by
Gill Steven S and Warner Holly S
Current Estimated Value
Home Financials for this Owner
Home Financials are based on the most recent Mortgage that was taken out on this home.
Original Mortgage
$416,800
Outstanding Balance
$376,538
Interest Rate
2.9%
Mortgage Type
New Conventional
Estimated Equity
$137,162
Purchase Details
Closed on
Aug 18, 2016
Sold by
Miller Amanda R
Bought by
Collett Diane and Collett Jonathan
Purchase Details
Closed on
May 30, 2014
Sold by
Smith Daniel S and Richardson Brandon M
Bought by
Miller Amanda R
Home Financials for this Owner
Home Financials are based on the most recent Mortgage that was taken out on this home.
Original Mortgage
$203,278
Interest Rate
4.23%
Mortgage Type
VA
Purchase Details
Closed on
Jun 1, 2012
Sold by
Carillo Mario
Bought by
Smith Daniel S
Home Financials for this Owner
Home Financials are based on the most recent Mortgage that was taken out on this home.
Original Mortgage
$147,172
Interest Rate
3.87%
Mortgage Type
FHA
Purchase Details
Closed on
May 25, 2012
Sold by
Smith Daniel S
Bought by
Smith Daniel S and Richardson Brandon M
Home Financials for this Owner
Home Financials are based on the most recent Mortgage that was taken out on this home.
Original Mortgage
$147,172
Interest Rate
3.87%
Mortgage Type
FHA
Purchase Details
Closed on
Mar 26, 2008
Sold by
Brown Lloyd R and Brown Anna M
Bought by
Carrillo Mario
Home Financials for this Owner
Home Financials are based on the most recent Mortgage that was taken out on this home.
Original Mortgage
$193,900
Interest Rate
5.72%
Mortgage Type
Purchase Money Mortgage
Purchase Details
Closed on
Dec 15, 2003
Sold by
Brown Lloyd R
Bought by
Brown Lloyd R and Brown Anna M
Purchase Details
Closed on
Oct 15, 2003
Sold by
Tolman Chad W and Tolman Janelle
Bought by
Brown Lloyd R
Home Financials for this Owner
Home Financials are based on the most recent Mortgage that was taken out on this home.
Original Mortgage
$141,110
Interest Rate
5.92%
Mortgage Type
VA
Purchase Details
Closed on
Jun 13, 2000
Sold by
Woodside Homes Corp
Bought by
Tolman Chad W and Tolman Janelle
Home Financials for this Owner
Home Financials are based on the most recent Mortgage that was taken out on this home.
Original Mortgage
$128,000
Interest Rate
8.08%
Create a Home Valuation Report for This Property
The Home Valuation Report is an in-depth analysis detailing your home's value as well as a comparison with similar homes in the area
Home Values in the Area
Average Home Value in this Area
Purchase History
| Date | Buyer | Sale Price | Title Company |
|---|---|---|---|
| Gill Steven S | -- | Vanguard Title Ins Unio | |
| Collett Diane | -- | Integrated Title | |
| Miller Amanda R | -- | Mountain View Title | |
| Smith Daniel S | -- | Backman Title Servic | |
| Smith Daniel S | -- | Accommodation | |
| Carrillo Mario | -- | First American Title | |
| Brown Lloyd R | -- | Backman Stewart Title Svcs | |
| Brown Lloyd R | -- | Bonneville Title Company Inc | |
| Tolman Chad W | -- | First American Title Co |
Source: Public Records
Mortgage History
| Date | Status | Borrower | Loan Amount |
|---|---|---|---|
| Open | Gill Steven S | $416,800 | |
| Previous Owner | Miller Amanda R | $203,278 | |
| Previous Owner | Smith Daniel S | $147,172 | |
| Previous Owner | Carrillo Mario | $193,900 | |
| Previous Owner | Brown Lloyd R | $141,110 | |
| Previous Owner | Tolman Chad W | $128,000 |
Source: Public Records
Tax History Compared to Growth
Tax History
| Year | Tax Paid | Tax Assessment Tax Assessment Total Assessment is a certain percentage of the fair market value that is determined by local assessors to be the total taxable value of land and additions on the property. | Land | Improvement |
|---|---|---|---|---|
| 2025 | $2,537 | $244,750 | $99,540 | $145,210 |
| 2024 | $2,554 | $248,050 | $73,000 | $175,050 |
| 2023 | $2,373 | $420,000 | $118,420 | $301,580 |
| 2022 | $2,579 | $250,250 | $55,603 | $194,647 |
| 2021 | $2,244 | $337,000 | $81,514 | $255,486 |
| 2020 | $1,877 | $273,000 | $61,870 | $211,130 |
| 2019 | $1,909 | $274,000 | $67,652 | $206,348 |
| 2018 | $1,769 | $252,000 | $67,106 | $184,894 |
| 2016 | $1,519 | $113,520 | $30,017 | $83,503 |
| 2015 | $1,492 | $106,150 | $30,017 | $76,133 |
| 2014 | $1,415 | $102,641 | $30,017 | $72,624 |
| 2013 | -- | $94,488 | $25,204 | $69,284 |
Source: Public Records
Map
Nearby Homes
- 2961 S 2425 W Unit 1123
- 2982 S 3000 W
- 2912 S 3000 W
- 2696 2495 S Unit 207
- 2524 S 3590 W Unit 602
- 2965 S 3000 W
- 2971 S 2425 W Unit 1124
- 2686 S 2440 W Unit 101
- 2635 S 2430 W Unit 114
- 3062 W Solace St
- 3360 W 2280 S
- 2679 W Antelope Dr
- 2297 W 2175 S
- 3704 W 2170 S Unit 111
- 2735 S Shoreline Dr
- 4344 W 1825 S Unit 102
- 4354 W 1825 S Unit 104
- 4348 W 1825 S Unit 103
- 2574 S 2430 W Unit 503
- 2237 Craig Ln