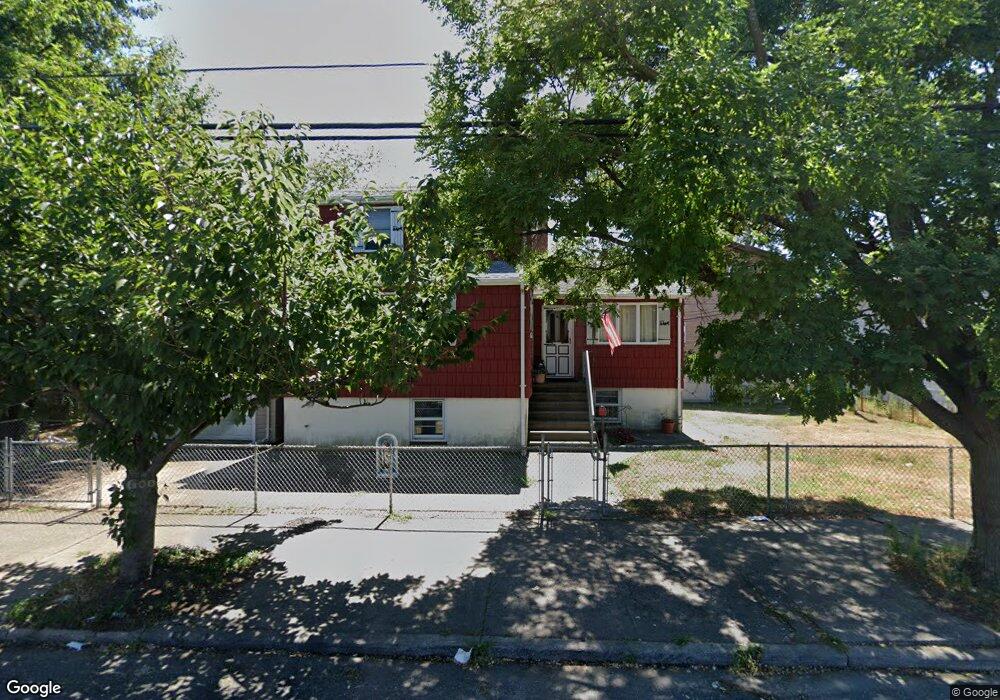
2974 Gerritsen Ave Brooklyn, NY 11229
Gerritsen Beach NeighborhoodEstimated Value: $866,000 - $1,136,000
--
Bed
--
Bath
2,274
Sq Ft
$415/Sq Ft
Est. Value
About This Home
This home is located at 2974 Gerritsen Ave, Brooklyn, NY 11229 and is currently estimated at $944,731, approximately $415 per square foot. 2974 Gerritsen Ave is a home located in Kings County with nearby schools including P.S. 277 Gerritsen Beach, J.H.S. 278 Marine Park, and New Visions Charter High School for Advanced Math/ Science.
Ownership History
Date
Name
Owned For
Owner Type
Purchase Details
Closed on
Jan 30, 2017
Sold by
Murphy Premises Revocable Trust
Bought by
Murphy Michael
Current Estimated Value
Home Financials for this Owner
Home Financials are based on the most recent Mortgage that was taken out on this home.
Original Mortgage
$100,000
Outstanding Balance
$82,796
Interest Rate
4.2%
Mortgage Type
Purchase Money Mortgage
Estimated Equity
$861,935
Create a Home Valuation Report for This Property
The Home Valuation Report is an in-depth analysis detailing your home's value as well as a comparison with similar homes in the area
Home Values in the Area
Average Home Value in this Area
Purchase History
| Date | Buyer | Sale Price | Title Company |
|---|---|---|---|
| Murphy Michael | $480,000 | -- |
Source: Public Records
Mortgage History
| Date | Status | Borrower | Loan Amount |
|---|---|---|---|
| Open | Murphy Michael | $100,000 |
Source: Public Records
Tax History Compared to Growth
Tax History
| Year | Tax Paid | Tax Assessment Tax Assessment Total Assessment is a certain percentage of the fair market value that is determined by local assessors to be the total taxable value of land and additions on the property. | Land | Improvement |
|---|---|---|---|---|
| 2025 | $7,795 | $76,620 | $15,960 | $60,660 |
| 2024 | $7,795 | $60,540 | $15,960 | $44,580 |
| 2023 | $7,441 | $64,500 | $15,960 | $48,540 |
| 2022 | $6,549 | $56,220 | $15,960 | $40,260 |
| 2021 | $6,823 | $49,740 | $15,960 | $33,780 |
| 2020 | $6,823 | $41,580 | $15,960 | $25,620 |
| 2019 | $6,766 | $39,840 | $15,960 | $23,880 |
| 2018 | $6,224 | $30,532 | $14,529 | $16,003 |
| 2017 | $5,872 | $28,804 | $12,540 | $16,264 |
| 2016 | $1,807 | $27,174 | $15,960 | $11,214 |
| 2015 | $964 | $23,220 | $7,980 | $15,240 |
| 2014 | $964 | $23,220 | $7,980 | $15,240 |
Source: Public Records
Map
Nearby Homes