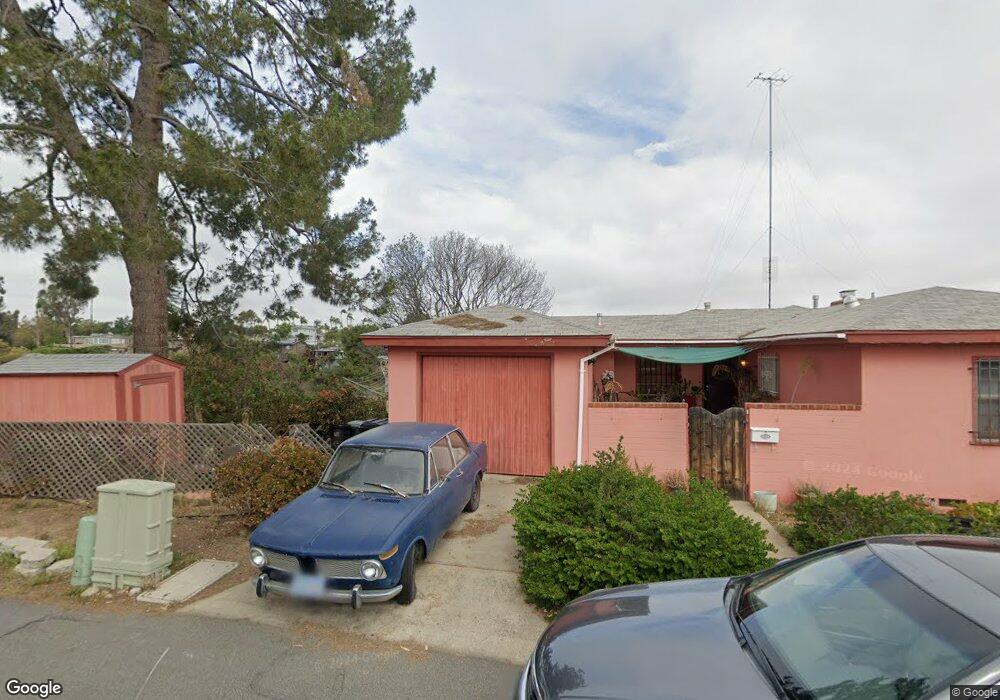
2974 Maple Ct San Diego, CA 92104
North Park NeighborhoodEstimated Value: $1,052,000 - $1,575,000
2
Beds
1
Bath
1,136
Sq Ft
$1,071/Sq Ft
Est. Value
About This Home
This home is located at 2974 Maple Ct, San Diego, CA 92104 and is currently estimated at $1,217,055, approximately $1,071 per square foot. 2974 Maple Ct is a home located in San Diego County with nearby schools including McKinley Elementary School, Roosevelt International Middle School, and Mcgill School Of Success.
Ownership History
Date
Name
Owned For
Owner Type
Purchase Details
Closed on
Jan 8, 2014
Sold by
Everett Sharon A
Bought by
Everett Saron A
Current Estimated Value
Home Financials for this Owner
Home Financials are based on the most recent Mortgage that was taken out on this home.
Original Mortgage
$228,000
Outstanding Balance
$171,265
Interest Rate
4.26%
Mortgage Type
New Conventional
Estimated Equity
$1,045,790
Purchase Details
Closed on
Apr 9, 2004
Sold by
Everett Sharon A
Bought by
Everett Sharon A
Purchase Details
Closed on
Apr 10, 2001
Sold by
Kittredge Lucile Zweck and Hagan Patricia K
Bought by
Everett Sharon A
Home Financials for this Owner
Home Financials are based on the most recent Mortgage that was taken out on this home.
Original Mortgage
$170,000
Interest Rate
7.03%
Mortgage Type
Seller Take Back
Purchase Details
Closed on
Oct 1, 1993
Sold by
Kittredge Lucile Zweck
Bought by
Kittredge Lucile Zweck and Hagan Patricia K
Create a Home Valuation Report for This Property
The Home Valuation Report is an in-depth analysis detailing your home's value as well as a comparison with similar homes in the area
Home Values in the Area
Average Home Value in this Area
Purchase History
| Date | Buyer | Sale Price | Title Company |
|---|---|---|---|
| Everett Saron A | -- | First American Title Company | |
| Everett Sharon A | -- | First American Title Company | |
| Everett Sharon A | -- | -- | |
| Everett Sharon A | $220,000 | Equity Title Company | |
| Kittredge Lucile Zweck | -- | -- |
Source: Public Records
Mortgage History
| Date | Status | Borrower | Loan Amount |
|---|---|---|---|
| Open | Everett Sharon A | $228,000 | |
| Closed | Everett Sharon A | $170,000 |
Source: Public Records
Tax History Compared to Growth
Tax History
| Year | Tax Paid | Tax Assessment Tax Assessment Total Assessment is a certain percentage of the fair market value that is determined by local assessors to be the total taxable value of land and additions on the property. | Land | Improvement |
|---|---|---|---|---|
| 2025 | $4,516 | $376,687 | $195,878 | $180,809 |
| 2024 | $4,516 | $369,302 | $192,038 | $177,264 |
| 2023 | $4,414 | $362,062 | $188,273 | $173,789 |
| 2022 | $4,294 | $354,964 | $184,582 | $170,382 |
| 2021 | $4,261 | $348,005 | $180,963 | $167,042 |
| 2020 | $4,209 | $344,438 | $179,108 | $165,330 |
| 2019 | $4,133 | $337,686 | $175,597 | $162,089 |
| 2018 | $3,864 | $331,065 | $172,154 | $158,911 |
| 2017 | $3,770 | $324,575 | $168,779 | $155,796 |
| 2016 | $3,708 | $318,212 | $165,470 | $152,742 |
| 2015 | $3,652 | $313,433 | $162,985 | $150,448 |
| 2014 | $3,594 | $307,294 | $159,793 | $147,501 |
Source: Public Records
Map
Nearby Homes
- 2950 Nutmeg St
- 2433 San Marcos Ave
- 3005 Olive St
- 2748 30th St
- 3045-49 Juniper St
- 2144 30th St
- 2126-34 30th St
- 3129 Redwood St
- 3132 31st St
- 2931 Thorn St
- 3124-26 32nd St
- 1930 30th St
- 3274 Redwood St
- 0 35th St
- 3365-69 Grim Ave
- 3376 30th St
- 3365 Grim Ave
- 1820 Bancroft St
- 1728 Bancroft St
- 3414 Villa Terrace
- 2982 Maple Ct Unit 84
- 2992 Maple Ct Unit 94
- 2973 Maple Ct
- 2985 Maple Ct
- 2966 Maple Ct
- 2962 Laurel St
- 2976 Laurel St
- 2968 Laurel St
- 2502 30th St
- 2954 Laurel St Unit D
- 2954 Laurel St Unit C
- 2954 Laurel St Unit B
- 2954 Laurel St Unit A
- 2515 30th St
- 2940 Laurel St
- 2938 Laurel St
- 2511 30th St
- 2516 San Marcos Ave
- 2512 San Marcos Ave
- 2514 San Marcos Ave