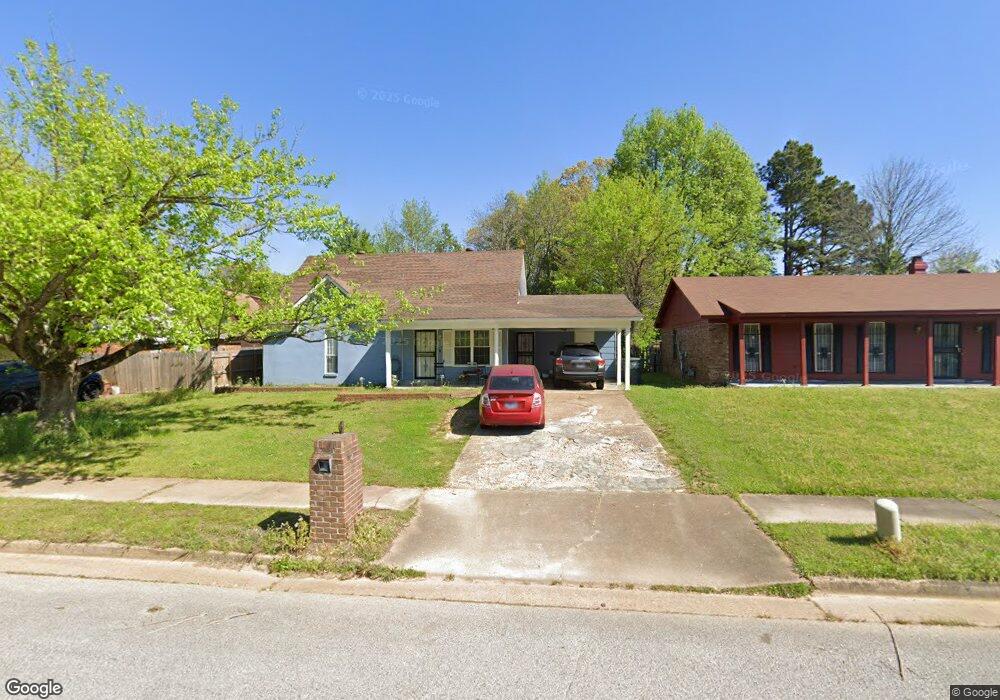
2974 Morningview Dr Memphis, TN 38118
Oakhaven NeighborhoodEstimated Value: $128,000 - $159,000
4
Beds
2
Baths
2,036
Sq Ft
$67/Sq Ft
Est. Value
About This Home
This home is located at 2974 Morningview Dr, Memphis, TN 38118 and is currently estimated at $137,424, approximately $67 per square foot. 2974 Morningview Dr is a home located in Shelby County with nearby schools including Ross Elementary School, Oakhaven Middle School, and Oakhaven High School.
Ownership History
Date
Name
Owned For
Owner Type
Purchase Details
Closed on
Apr 1, 2011
Sold by
Tennessee Housing Development Agency
Bought by
Secretary Of Housing & Urban Development
Current Estimated Value
Purchase Details
Closed on
Mar 10, 2011
Sold by
Evans Vasta Rhonita and Evans Vasta R
Bought by
Tennessee Housing Development Agency
Purchase Details
Closed on
May 29, 1998
Sold by
United Housing Inc
Bought by
Evans Vasta Rhonita
Home Financials for this Owner
Home Financials are based on the most recent Mortgage that was taken out on this home.
Original Mortgage
$54,971
Interest Rate
7.15%
Mortgage Type
FHA
Purchase Details
Closed on
Nov 21, 1997
Sold by
Fleet Real Estate Funding Corp
Bought by
Hud
Purchase Details
Closed on
Jul 11, 1997
Sold by
Johnson Levi and Johnson Shirley Moton
Bought by
Fleet Real Estate Funding Corp
Create a Home Valuation Report for This Property
The Home Valuation Report is an in-depth analysis detailing your home's value as well as a comparison with similar homes in the area
Home Values in the Area
Average Home Value in this Area
Purchase History
| Date | Buyer | Sale Price | Title Company |
|---|---|---|---|
| Secretary Of Housing & Urban Development | $56,380 | None Available | |
| Tennessee Housing Development Agency | $56,380 | None Available | |
| Evans Vasta Rhonita | $55,000 | -- | |
| Hud | -- | -- | |
| Fleet Real Estate Funding Corp | $68,831 | -- |
Source: Public Records
Mortgage History
| Date | Status | Borrower | Loan Amount |
|---|---|---|---|
| Previous Owner | Evans Vasta Rhonita | $54,971 |
Source: Public Records
Tax History Compared to Growth
Tax History
| Year | Tax Paid | Tax Assessment Tax Assessment Total Assessment is a certain percentage of the fair market value that is determined by local assessors to be the total taxable value of land and additions on the property. | Land | Improvement |
|---|---|---|---|---|
| 2025 | $670 | $32,050 | $3,625 | $28,425 |
| 2024 | $670 | $19,775 | $3,000 | $16,775 |
| 2023 | $1,205 | $19,775 | $3,000 | $16,775 |
| 2022 | $1,205 | $19,775 | $3,000 | $16,775 |
| 2021 | $1,219 | $19,775 | $3,000 | $16,775 |
| 2020 | $1,109 | $15,300 | $3,000 | $12,300 |
| 2019 | $1,109 | $15,300 | $3,000 | $12,300 |
| 2018 | $1,109 | $15,300 | $3,000 | $12,300 |
| 2017 | $629 | $15,300 | $3,000 | $12,300 |
| 2016 | $642 | $14,700 | $0 | $0 |
| 2014 | $642 | $14,700 | $0 | $0 |
Source: Public Records
Map
Nearby Homes
- 2974 Larkwood Cove
- 4987 Scenicwood Cove
- 5082 Golden Oaks Dr
- 3190 Applewood Cove
- 3118 Argot Ave
- 3102 Comet Cove
- 3213 Applewood Cove
- 5013 Holly Ridge Dr
- 5253 Zodiac Rd
- 5263 Zodiac Rd
- 5273 Zodiac Rd
- 5259 Zodiac Rd
- 5283 Zodiac Rd
- 5279 Zodiac Rd
- 3356 Burgess Dr
- 4752 Lofts Rd
- 3480 Cloudland Dr
- 4759 Allrand Rd
- 3457 Meier Dr
- 3554 Morning Dew Ct Unit 11
- 2982 Morningview Dr
- 2966 Morningview Dr
- 5028 Larkwood Dr
- 2988 Morningview Dr
- 5022 Larkwood Dr
- 5029 Cedar View Rd
- 5016 Larkwood Dr
- 5037 Cedar View Rd
- 5021 Cedar View Rd
- 2973 Morningview Dr
- 2981 Morningview Dr
- 2965 Morningview Dr
- 5033 Larkwood Dr
- 2987 Morningview Dr
- 5015 Cedar View Rd
- 5010 Larkwood Dr
- 5027 Larkwood Dr
- 2993 Morningview Dr
- 2973 Larkwood Cove
- 5021 Larkwood Dr