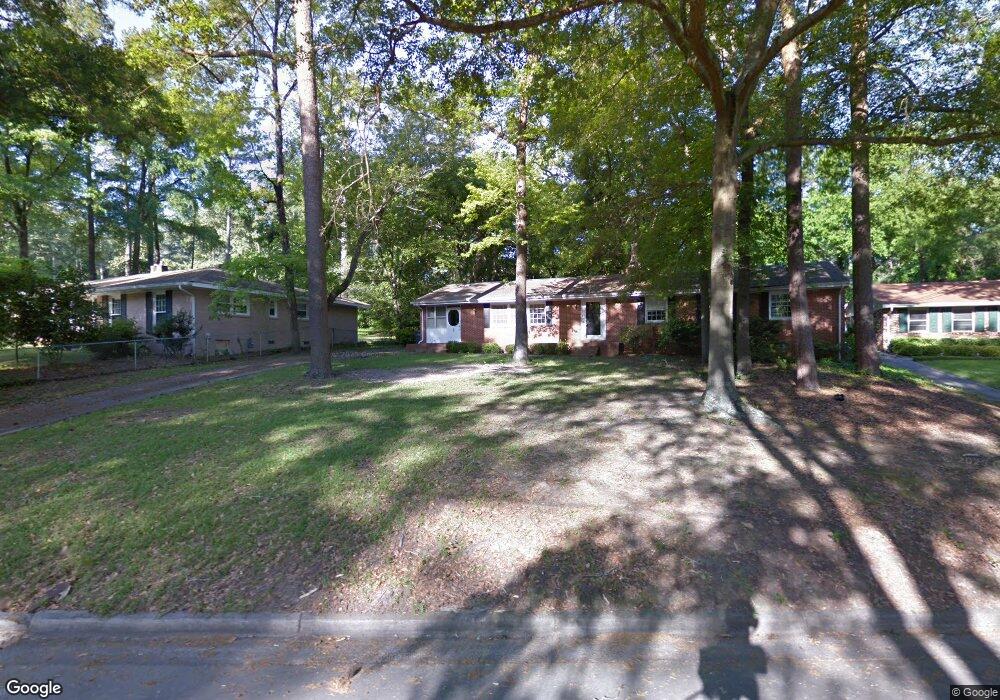
2975 Fox Spring Cir Augusta, GA 30909
Forest Hills NeighborhoodEstimated Value: $228,000 - $394,000
3
Beds
2
Baths
1,740
Sq Ft
$160/Sq Ft
Est. Value
About This Home
This home is located at 2975 Fox Spring Cir, Augusta, GA 30909 and is currently estimated at $277,955, approximately $159 per square foot. 2975 Fox Spring Cir is a home located in Richmond County with nearby schools including R.B. Hunt Elementary School, Lake Forest Hills Elementary School, and Langford Middle School.
Ownership History
Date
Name
Owned For
Owner Type
Purchase Details
Closed on
Feb 27, 2007
Sold by
Purchasers Realty Corp
Bought by
Harrison J Michael
Current Estimated Value
Home Financials for this Owner
Home Financials are based on the most recent Mortgage that was taken out on this home.
Original Mortgage
$156,700
Outstanding Balance
$94,013
Interest Rate
6.19%
Mortgage Type
Purchase Money Mortgage
Estimated Equity
$183,942
Purchase Details
Closed on
Jun 3, 2005
Sold by
Sundem Scott A
Bought by
Purchasers Realty Corp
Home Financials for this Owner
Home Financials are based on the most recent Mortgage that was taken out on this home.
Original Mortgage
$101,000
Interest Rate
8.5%
Mortgage Type
Purchase Money Mortgage
Purchase Details
Closed on
Apr 30, 1993
Sold by
Norvell Lynn M F and Norvell K
Bought by
Sundem Scott A
Create a Home Valuation Report for This Property
The Home Valuation Report is an in-depth analysis detailing your home's value as well as a comparison with similar homes in the area
Home Values in the Area
Average Home Value in this Area
Purchase History
| Date | Buyer | Sale Price | Title Company |
|---|---|---|---|
| Harrison J Michael | -- | None Available | |
| Purchasers Realty Corp | $124,300 | -- | |
| Sundem Scott A | -- | -- |
Source: Public Records
Mortgage History
| Date | Status | Borrower | Loan Amount |
|---|---|---|---|
| Open | Harrison J Michael | $156,700 | |
| Previous Owner | Purchasers Realty Corp | $101,000 |
Source: Public Records
Tax History Compared to Growth
Tax History
| Year | Tax Paid | Tax Assessment Tax Assessment Total Assessment is a certain percentage of the fair market value that is determined by local assessors to be the total taxable value of land and additions on the property. | Land | Improvement |
|---|---|---|---|---|
| 2025 | $2,908 | $87,253 | $18,295 | $68,958 |
| 2024 | $2,908 | $65,013 | $18,295 | $46,718 |
| 2023 | $1,069 | $27,383 | $18,295 | $9,088 |
| 2022 | $1,579 | $41,479 | $18,295 | $23,184 |
| 2021 | $1,608 | $38,635 | $18,295 | $20,340 |
| 2020 | $1,460 | $34,794 | $18,295 | $16,499 |
| 2019 | $1,542 | $34,794 | $18,295 | $16,499 |
| 2018 | $1,554 | $34,794 | $18,295 | $16,499 |
| 2017 | $1,547 | $34,794 | $18,295 | $16,499 |
| 2016 | $1,547 | $34,794 | $18,295 | $16,499 |
| 2015 | $1,880 | $51,576 | $18,295 | $33,281 |
| 2014 | $2,159 | $51,576 | $18,295 | $33,281 |
Source: Public Records
Map
Nearby Homes
- 3011 Fox Spring Rd
- 600 Bransford Rd
- 814 Windsor Ct
- 3012 Walton Way
- 712 Westminster Ct
- 3134 Switzer Dr
- 2875 Lake Forest Dr
- 3348 Walton Way
- 3071 Walton Way
- 756 Oberlin Rd
- 3075 Walton Way
- 2923 Henry St
- 3160 Donald Rd
- 2818 Hazel St
- 3013 Cardinal Dr
- 2904 Lombardy Ct
- 565 Martin Ln
- 552 Whitehead Dr
- 750 Lancaster Rd
- 2823 Walters Ct
- 2973 Fox Spring Cir
- 2979 Fox Spring Cir
- 815 Conifer Rd
- 2976 Fox Spring Cir
- 3029 Fox Spring Rd
- 2978 Fox Spring Cir
- 3027 Fox Spring Rd
- 814 Conifer Rd
- 3021 Church Rd
- 3031 Fox Spring Rd
- 3023 Church Rd
- 2980 Fox Spring Cir
- 2980 Fox
- 3033 Fox Spring Rd
- 3025 Fox Spring Rd
- 3025 Church Rd
- 828 Windsor Ct
- 3035 Fox Spring Rd
- 3023 Fox Spring Rd
- 812 Conifer Rd