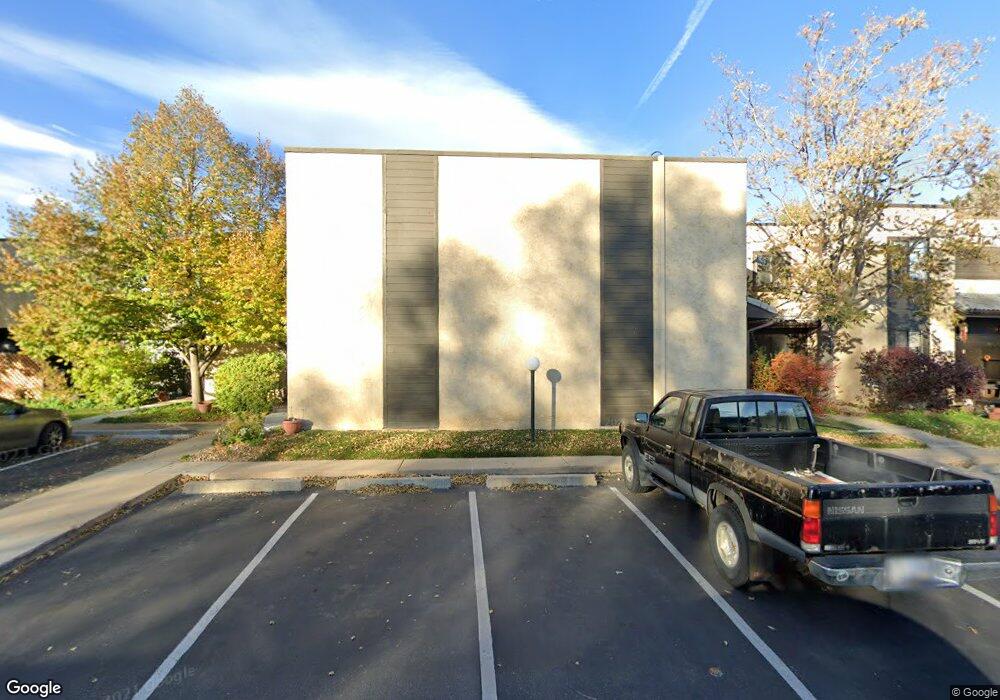
2975 Shady Hollow E Unit 6 Boulder, CO 80304
Crossroads NeighborhoodEstimated Value: $508,000 - $567,000
3
Beds
4
Baths
1,645
Sq Ft
$325/Sq Ft
Est. Value
About This Home
This home is located at 2975 Shady Hollow E Unit 6, Boulder, CO 80304 and is currently estimated at $535,428, approximately $325 per square foot. 2975 Shady Hollow E Unit 6 is a home located in Boulder County with nearby schools including Columbine Elementary School, Casey Middle School, and Boulder High School.
Ownership History
Date
Name
Owned For
Owner Type
Purchase Details
Closed on
Oct 19, 2005
Sold by
Stream Thomas L and Stream Barbara A
Bought by
Davis Sean B
Current Estimated Value
Home Financials for this Owner
Home Financials are based on the most recent Mortgage that was taken out on this home.
Original Mortgage
$168,000
Outstanding Balance
$89,751
Interest Rate
5.73%
Mortgage Type
Fannie Mae Freddie Mac
Estimated Equity
$445,677
Purchase Details
Closed on
May 24, 1996
Sold by
Anstead Kristine M
Bought by
Stream Thomas L
Home Financials for this Owner
Home Financials are based on the most recent Mortgage that was taken out on this home.
Original Mortgage
$115,200
Interest Rate
7.93%
Mortgage Type
Balloon
Purchase Details
Closed on
Aug 9, 1993
Bought by
Davis Sean B and Davis Lawrence R
Purchase Details
Closed on
Jun 18, 1981
Bought by
Davis Sean B and Davis Lawrence R
Purchase Details
Closed on
Apr 4, 1979
Bought by
Davis Sean B and Davis Lawrence R
Create a Home Valuation Report for This Property
The Home Valuation Report is an in-depth analysis detailing your home's value as well as a comparison with similar homes in the area
Home Values in the Area
Average Home Value in this Area
Purchase History
| Date | Buyer | Sale Price | Title Company |
|---|---|---|---|
| Davis Sean B | $210,000 | First Colorado Title | |
| Stream Thomas L | $144,000 | -- | |
| Davis Sean B | $91,500 | -- | |
| Davis Sean B | $75,200 | -- | |
| Davis Sean B | -- | -- |
Source: Public Records
Mortgage History
| Date | Status | Borrower | Loan Amount |
|---|---|---|---|
| Open | Davis Sean B | $168,000 | |
| Previous Owner | Stream Thomas L | $115,200 |
Source: Public Records
Tax History
| Year | Tax Paid | Tax Assessment Tax Assessment Total Assessment is a certain percentage of the fair market value that is determined by local assessors to be the total taxable value of land and additions on the property. | Land | Improvement |
|---|---|---|---|---|
| 2025 | $3,028 | $35,256 | $18,500 | $16,756 |
| 2024 | $3,028 | $35,256 | $18,500 | $16,756 |
| 2023 | $2,976 | $34,458 | $19,517 | $18,626 |
| 2022 | $3,011 | $32,422 | $15,464 | $16,958 |
| 2021 | $2,871 | $33,355 | $15,909 | $17,446 |
| 2020 | $2,808 | $32,254 | $14,515 | $17,739 |
| 2019 | $2,765 | $32,254 | $14,515 | $17,739 |
| 2018 | $2,381 | $27,461 | $11,160 | $16,301 |
| 2017 | $2,306 | $30,359 | $12,338 | $18,021 |
| 2016 | $2,066 | $23,872 | $9,711 | $14,161 |
| 2015 | $1,957 | $20,640 | $5,890 | $14,750 |
| 2014 | $1,735 | $20,640 | $5,890 | $14,750 |
Source: Public Records
Map
Nearby Homes
- 2707 Valmont Rd Unit D-304
- 2707 Valmont Rd Unit 312D
- 2707 Valmont Rd Unit 106 Bonus!
- 2707 Valmont Rd Unit 311A
- 3120 Eastwood Ct
- 2530 28th St Unit 118
- 2711 Mapleton Ave Unit 9
- 3077 29th St Unit 105
- 3077 29th St Unit 104
- 2727 Folsom St Unit 303
- 2727 Folsom St Unit 218
- 2991 25th St
- 2515 Bluff St
- 2936 Eagle Way
- 3065 30th St Unit 1B
- 3055 30th St Unit 4A
- 2718 Pine St Unit 301
- 3125 Fremont St
- 3225 Arnett St
- 2595 Glenwood Dr
- 2975 Shady Hollow E
- 2979 Shady Hollow E
- 2971 Shady Hollow E
- 2985 Shady Hollow E
- 2969 Shady Hollow E
- 2989 Shady Hollow E
- 2965 Shady Hollow E
- 2965 Shady Hollow E Unit 2
- 2965 Shady Hollow E Unit E
- 2978 Shady Hollow W Unit B5
- 2995 Shady Hollow E
- 2980 Shady Hollow W Unit B4
- 2962 Shadow Cr #205 Unit 205
- 2961 Shady Hollow E
- 2961 Shady Hollow E Unit G-3
- 2961 Shady Hollow E Unit 3
- 2999 Shady Hollow E
- 2976 Shady Hollow W
- 2974 Shady Hollow W
- 2974 Shady Hollow W Unit 7
Your Personal Tour Guide
Ask me questions while you tour the home.