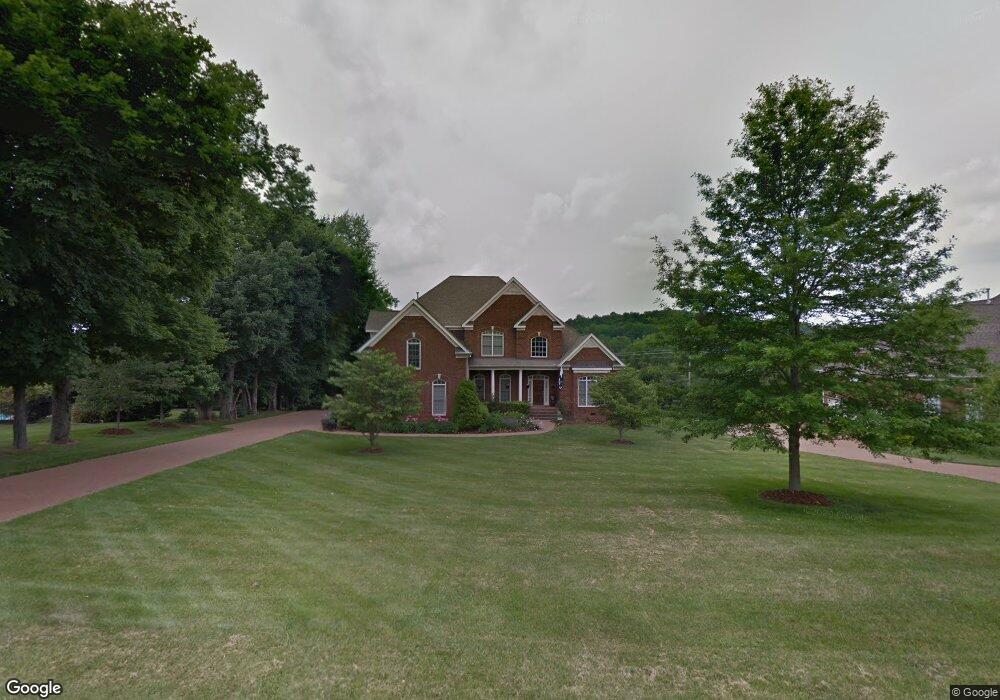
2976 Mclemore Cir Franklin, TN 37064
McLemore NeighborhoodEstimated Value: $1,449,000 - $1,543,000
--
Bed
5
Baths
4,454
Sq Ft
$333/Sq Ft
Est. Value
About This Home
This home is located at 2976 Mclemore Cir, Franklin, TN 37064 and is currently estimated at $1,483,292, approximately $333 per square foot. 2976 Mclemore Cir is a home located in Williamson County with nearby schools including Oak View Elementary School and Legacy Middle School.
Ownership History
Date
Name
Owned For
Owner Type
Purchase Details
Closed on
Jun 1, 2015
Sold by
Whited Michael L and Whited Jeannette M
Bought by
Crowley Jack and Crowley Jennifer
Current Estimated Value
Home Financials for this Owner
Home Financials are based on the most recent Mortgage that was taken out on this home.
Original Mortgage
$485,000
Outstanding Balance
$375,112
Interest Rate
3.79%
Mortgage Type
New Conventional
Estimated Equity
$1,108,180
Purchase Details
Closed on
Jun 3, 2005
Sold by
Sun Custom Homes Inc
Bought by
Whited Michael L and Whited Jeannette M
Home Financials for this Owner
Home Financials are based on the most recent Mortgage that was taken out on this home.
Original Mortgage
$359,650
Interest Rate
5.66%
Mortgage Type
Fannie Mae Freddie Mac
Create a Home Valuation Report for This Property
The Home Valuation Report is an in-depth analysis detailing your home's value as well as a comparison with similar homes in the area
Home Values in the Area
Average Home Value in this Area
Purchase History
| Date | Buyer | Sale Price | Title Company |
|---|---|---|---|
| Crowley Jack | $615,000 | None Available | |
| Whited Michael L | $549,000 | Mcmackin Title |
Source: Public Records
Mortgage History
| Date | Status | Borrower | Loan Amount |
|---|---|---|---|
| Open | Crowley Jack | $485,000 | |
| Previous Owner | Whited Michael L | $359,650 |
Source: Public Records
Tax History Compared to Growth
Tax History
| Year | Tax Paid | Tax Assessment Tax Assessment Total Assessment is a certain percentage of the fair market value that is determined by local assessors to be the total taxable value of land and additions on the property. | Land | Improvement |
|---|---|---|---|---|
| 2025 | $3,769 | $320,625 | $82,500 | $238,125 |
| 2024 | $3,769 | $200,475 | $50,000 | $150,475 |
| 2023 | $3,769 | $200,475 | $50,000 | $150,475 |
| 2022 | $3,769 | $200,475 | $50,000 | $150,475 |
| 2021 | $3,769 | $200,475 | $50,000 | $150,475 |
| 2020 | $3,582 | $161,350 | $30,000 | $131,350 |
| 2019 | $3,582 | $161,350 | $30,000 | $131,350 |
| 2018 | $3,469 | $161,350 | $30,000 | $131,350 |
| 2017 | $3,469 | $161,350 | $30,000 | $131,350 |
| 2016 | $3,469 | $161,350 | $30,000 | $131,350 |
| 2015 | -- | $140,625 | $21,250 | $119,375 |
| 2014 | -- | $140,625 | $21,250 | $119,375 |
Source: Public Records
Map
Nearby Homes
- 2562 Goose Creek Bypass
- 2803 Cale Ct
- 2629 Goose Creek Bypass
- 4021 Baileys Cove Ct
- 4030 Forestside Dr
- 8025 Southvale Blvd
- 4268 Columbia Pike
- 5009 Legrand Ave
- 4012 Forestside Dr
- 7018 Southvale Blvd
- 4000 Forestside Dr
- 7031 Southvale Blvd
- 8013 Southvale Blvd
- 4024 Forestside Dr
- 4006 Forestside Dr
- 8007 Southvale Blvd
- 8006 Southvale Blvd
- 1760 Masters Dr
- 2740 Mclemore Rd
- 2115 Hollydale Aly
- 2980 Mclemore Cir
- 3100 Stadium Ct
- 3104 Stadium Ct
- 2984 Mclemore Cir
- 2975 Mclemore Cir
- 3108 Stadium Ct
- 2983 Mclemore Cir
- 2988 Mclemore Cir
- 3101 Stadium Ct
- 3105 Stadium Ct
- 2967 Mclemore Cir
- 2987 Mclemore Cir
- 1108 Pigskin Ct
- 2992 Mclemore Cir
- 1112 Pigskin Ct
- 2964 Mclemore Cir
- 2955 Mclemore Cir
- 1104 Pigskin Ct
- 2996 Mclemore Cir
- 2995 Mclemore Cir