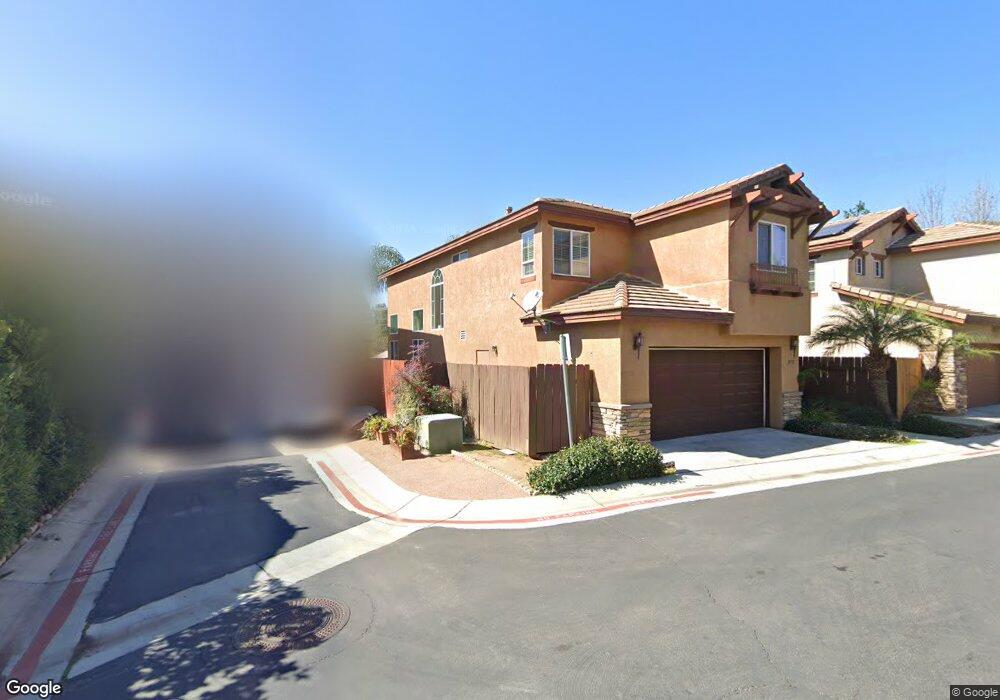
29778 Benchmark Ct Escondido, CA 92026
Estimated Value: $709,324 - $766,000
4
Beds
3
Baths
1,597
Sq Ft
$454/Sq Ft
Est. Value
About This Home
This home is located at 29778 Benchmark Ct, Escondido, CA 92026 and is currently estimated at $725,581, approximately $454 per square foot. 29778 Benchmark Ct is a home located in San Diego County with nearby schools including Lilac, Valley Center Middle School, and Valley Center High School.
Ownership History
Date
Name
Owned For
Owner Type
Purchase Details
Closed on
Apr 29, 2021
Sold by
Saunders Mary and Nunez Mary C
Bought by
Saunders Mary and Saunders William Rhett
Current Estimated Value
Home Financials for this Owner
Home Financials are based on the most recent Mortgage that was taken out on this home.
Original Mortgage
$183,000
Outstanding Balance
$151,897
Interest Rate
2.93%
Mortgage Type
New Conventional
Estimated Equity
$573,684
Purchase Details
Closed on
Oct 2, 2002
Sold by
I C Courtyards Inc
Bought by
Nunez Mary C
Home Financials for this Owner
Home Financials are based on the most recent Mortgage that was taken out on this home.
Original Mortgage
$215,950
Interest Rate
5.96%
Create a Home Valuation Report for This Property
The Home Valuation Report is an in-depth analysis detailing your home's value as well as a comparison with similar homes in the area
Home Values in the Area
Average Home Value in this Area
Purchase History
| Date | Buyer | Sale Price | Title Company |
|---|---|---|---|
| Saunders Mary | -- | Lawyers Title Company | |
| Nunez Mary C | $270,000 | Stewart Title |
Source: Public Records
Mortgage History
| Date | Status | Borrower | Loan Amount |
|---|---|---|---|
| Open | Saunders Mary | $183,000 | |
| Previous Owner | Nunez Mary C | $215,950 |
Source: Public Records
Tax History Compared to Growth
Tax History
| Year | Tax Paid | Tax Assessment Tax Assessment Total Assessment is a certain percentage of the fair market value that is determined by local assessors to be the total taxable value of land and additions on the property. | Land | Improvement |
|---|---|---|---|---|
| 2025 | $4,891 | $390,888 | $105,575 | $285,313 |
| 2024 | $4,891 | $383,224 | $103,505 | $279,719 |
| 2023 | $4,765 | $375,711 | $101,476 | $274,235 |
| 2022 | $4,680 | $368,345 | $99,487 | $268,858 |
| 2021 | $4,568 | $361,124 | $97,537 | $263,587 |
| 2020 | $4,530 | $357,422 | $96,537 | $260,885 |
| 2019 | $4,539 | $350,415 | $94,645 | $255,770 |
| 2018 | $4,411 | $343,545 | $92,790 | $250,755 |
| 2017 | $4,313 | $336,810 | $90,971 | $245,839 |
| 2016 | $4,312 | $330,207 | $89,188 | $241,019 |
| 2015 | $4,149 | $325,248 | $87,849 | $237,399 |
| 2014 | $4,055 | $318,878 | $86,129 | $232,749 |
Source: Public Records
Map
Nearby Homes
- 29818 Hillside View Ct
- 29711 Williams Valley Ct
- 29825 Platanus Dr
- 8925 Circle r View Ln
- 8949 Circle r View Ln
- 8539 Circle r Valley Ln
- 9168 Old Castle Rd
- 0 Circle r Dr
- 15 Circle r Dr
- 0 Ridge Creek Rd Unit NDP2508679
- 0 Captains Ct
- 0 Circle r Dr
- 30015 Ridge Creek Rd
- 30508 Circle r Ln
- Lot 92 Welk Highland Ln
- 1411 Wild Acres Rd
- 30427 Circle r Ln
- 945 El Paseo
- 8310 Nelson Way Unit 98
- 9698 Welk View Dr
- 29790 Benchmark Ct
- 29762 Benchmark Ct
- 29756 Benchmark Ct
- 29779 Benchmark Ct
- 29791 Benchmark Ct
- 29744 Benchmark Ct
- 29716 Benchmark Ct
- 29707 Benchmark Ct
- 29763 Circle r Ct
- 29785 Nandina Dr
- 29777 Nandina Dr
- 29836 Hillside View Ct
- 29837 Hillside View Ct
- 29714 Canyon Wash Ct
- 29755 Circle r Ct
- 29727 Canyon Wash Ct
- 29816 Tricia Ann Ct
- 29769 Nandina Dr
- 29834 Tricia Ann Ct
- 29855 Hillside View Ct