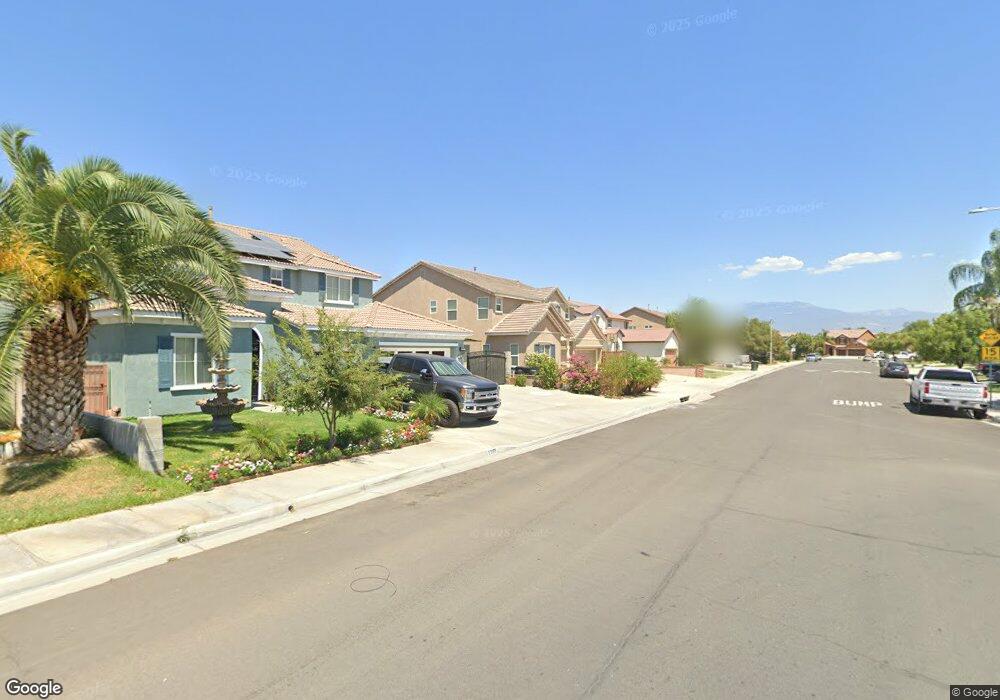
2979 Crooked Branch Way San Jacinto, CA 92582
Estimated Value: $542,296 - $572,000
4
Beds
4
Baths
3,127
Sq Ft
$179/Sq Ft
Est. Value
About This Home
This home is located at 2979 Crooked Branch Way, San Jacinto, CA 92582 and is currently estimated at $558,824, approximately $178 per square foot. 2979 Crooked Branch Way is a home located in Riverside County with nearby schools including Megan Cope Elementary School, Monte Vista Middle School, and San Jacinto High School.
Ownership History
Date
Name
Owned For
Owner Type
Purchase Details
Closed on
Sep 7, 2010
Sold by
Trikha Brenda Sue
Bought by
Trikha Rohit
Current Estimated Value
Purchase Details
Closed on
Aug 25, 2010
Sold by
U S Bank Association
Bought by
Trikha Rohit
Purchase Details
Closed on
Jan 11, 2010
Sold by
Munoz Jaime Alejandro
Bought by
U S Bank National Association
Purchase Details
Closed on
Jan 18, 2008
Sold by
Munoz Jaime Alejandro
Bought by
Espinoza Marina
Purchase Details
Closed on
Feb 7, 2007
Sold by
Western Pacific Housing Inc
Bought by
Munoz Jaime Alejandro
Home Financials for this Owner
Home Financials are based on the most recent Mortgage that was taken out on this home.
Original Mortgage
$279,992
Interest Rate
6%
Mortgage Type
Purchase Money Mortgage
Create a Home Valuation Report for This Property
The Home Valuation Report is an in-depth analysis detailing your home's value as well as a comparison with similar homes in the area
Home Values in the Area
Average Home Value in this Area
Purchase History
| Date | Buyer | Sale Price | Title Company |
|---|---|---|---|
| Trikha Rohit | -- | Lsi Title Company Ca | |
| Trikha Rohit | $155,000 | Lsi Title Company Ca | |
| U S Bank National Association | $140,250 | None Available | |
| Espinoza Marina | -- | Accommodation | |
| Munoz Jaime Alejandro | $350,000 | Chicago Title |
Source: Public Records
Mortgage History
| Date | Status | Borrower | Loan Amount |
|---|---|---|---|
| Previous Owner | Munoz Jaime Alejandro | $279,992 |
Source: Public Records
Tax History Compared to Growth
Tax History
| Year | Tax Paid | Tax Assessment Tax Assessment Total Assessment is a certain percentage of the fair market value that is determined by local assessors to be the total taxable value of land and additions on the property. | Land | Improvement |
|---|---|---|---|---|
| 2025 | $7,114 | $198,565 | $51,239 | $147,326 |
| 2023 | $7,114 | $190,856 | $49,250 | $141,606 |
| 2022 | $6,633 | $187,115 | $48,285 | $138,830 |
| 2021 | $6,473 | $183,447 | $47,339 | $136,108 |
| 2020 | $6,412 | $181,567 | $46,854 | $134,713 |
| 2019 | $6,308 | $178,008 | $45,936 | $132,072 |
| 2018 | $6,300 | $174,519 | $45,036 | $129,483 |
| 2017 | $6,144 | $171,098 | $44,153 | $126,945 |
| 2016 | $5,635 | $167,744 | $43,288 | $124,456 |
| 2015 | $5,618 | $165,227 | $42,639 | $122,588 |
| 2014 | $5,634 | $161,992 | $41,804 | $120,188 |
Source: Public Records
Map
Nearby Homes
- 629 Peregrine Ln
- 710 Highlands Dr
- 724 Highlands Dr
- 557 Peregrine Ln
- 738 Highlands Dr
- 723 Highlands Dr
- 3095 Desiree Dr
- 3065 Desiree Dr
- 3025 Desiree Dr
- 3075 Desiree Dr
- 2961 Desiree Dr
- 537 Peregrine Ln
- 722 Belmont Ln
- 477 Overleaf Way
- 752 Highlands Dr
- 737 Highlands Dr
- Guadalupe Plan at Esplanade
- Picacho Plan at Esplanade
- Tortolita Plan at Esplanade
- Mingus Plan at Esplanade
- 2989 Crooked Branch Way
- 2969 Crooked Branch Way
- 599 Peregrine Ln
- 609 Peregrine Ln
- 2991 Crooked Branch Way
- 2959 Crooked Branch Way
- 2958 Silent Spring Ln
- 2970 Crooked Branch Way
- 2960 Crooked Branch Way
- 619 Peregrine Ln
- 2950 Silent Spring Ln
- 2999 Crooked Branch Way
- 2951 Crooked Branch Way
- 2968 Silent Spring Ln
- 2952 Crooked Branch Way
- 2992 Crooked Branch Way
- 2940 Crooked Branch Way
- 3002 Crooked Branch Way
- 2939 Crooked Branch Way
- 2938 Silent Spring Ln