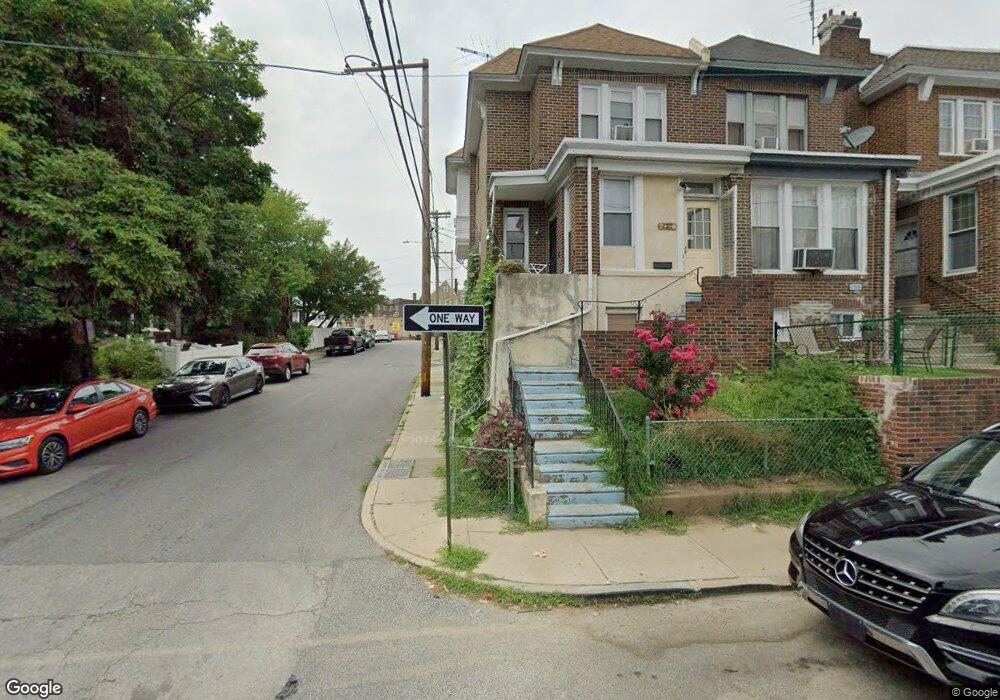
298 Copley Rd Upper Darby, PA 19082
Estimated Value: $216,000 - $263,000
--
Bed
2
Baths
1,850
Sq Ft
$132/Sq Ft
Est. Value
About This Home
This home is located at 298 Copley Rd, Upper Darby, PA 19082 and is currently estimated at $244,340, approximately $132 per square foot. 298 Copley Rd is a home located in Delaware County with nearby schools including Bywood Elementary School, Upper Darby High School, and Vision Academy Charter School.
Ownership History
Date
Name
Owned For
Owner Type
Purchase Details
Closed on
Apr 26, 2017
Sold by
Singe Puran
Bought by
Ahmed Azam and Sultana Tasnin
Current Estimated Value
Purchase Details
Closed on
Feb 15, 2011
Sold by
Easy Money Lending Corp
Bought by
Singh Puran
Home Financials for this Owner
Home Financials are based on the most recent Mortgage that was taken out on this home.
Original Mortgage
$106,236
Interest Rate
4.75%
Mortgage Type
FHA
Purchase Details
Closed on
Jun 11, 2010
Sold by
Collins Harry
Bought by
Easty Money Lending Corp
Create a Home Valuation Report for This Property
The Home Valuation Report is an in-depth analysis detailing your home's value as well as a comparison with similar homes in the area
Home Values in the Area
Average Home Value in this Area
Purchase History
| Date | Buyer | Sale Price | Title Company |
|---|---|---|---|
| Ahmed Azam | $106,000 | None Available | |
| Singh Puran | $109,000 | Fidelity National Title Insu | |
| Easty Money Lending Corp | $53,000 | Golden Title Agency |
Source: Public Records
Mortgage History
| Date | Status | Borrower | Loan Amount |
|---|---|---|---|
| Previous Owner | Singh Puran | $106,236 |
Source: Public Records
Tax History Compared to Growth
Tax History
| Year | Tax Paid | Tax Assessment Tax Assessment Total Assessment is a certain percentage of the fair market value that is determined by local assessors to be the total taxable value of land and additions on the property. | Land | Improvement |
|---|---|---|---|---|
| 2025 | $4,528 | $107,060 | $21,480 | $85,580 |
| 2024 | $4,528 | $107,060 | $21,480 | $85,580 |
| 2023 | $4,485 | $107,060 | $21,480 | $85,580 |
| 2022 | $4,364 | $107,060 | $21,480 | $85,580 |
| 2021 | $5,885 | $107,060 | $21,480 | $85,580 |
| 2020 | $3,881 | $60,000 | $16,710 | $43,290 |
| 2019 | $3,813 | $60,000 | $16,710 | $43,290 |
| 2018 | $3,769 | $60,000 | $0 | $0 |
| 2017 | $3,671 | $60,000 | $0 | $0 |
| 2016 | $329 | $60,000 | $0 | $0 |
| 2015 | $329 | $60,000 | $0 | $0 |
| 2014 | $329 | $60,000 | $0 | $0 |
Source: Public Records
Map
Nearby Homes