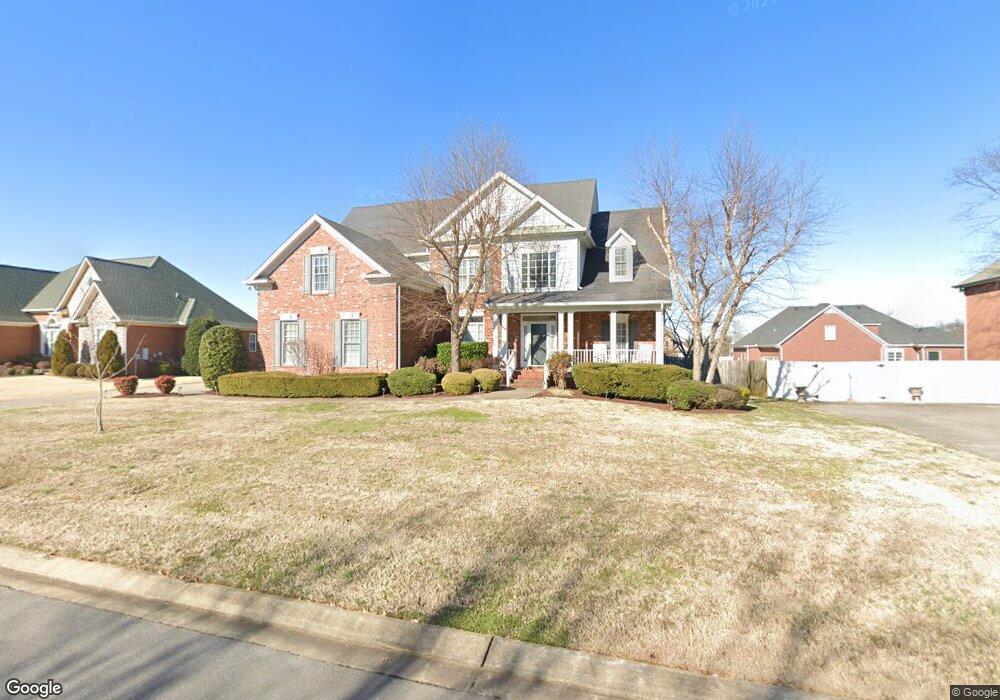
298 Kevin Dr Murfreesboro, TN 37129
Estimated Value: $519,000 - $585,000
--
Bed
3
Baths
2,987
Sq Ft
$186/Sq Ft
Est. Value
About This Home
This home is located at 298 Kevin Dr, Murfreesboro, TN 37129 and is currently estimated at $554,996, approximately $185 per square foot. 298 Kevin Dr is a home located in Rutherford County with nearby schools including Northfield Elementary School, Siegel Middle School, and Siegel High School.
Ownership History
Date
Name
Owned For
Owner Type
Purchase Details
Closed on
Nov 15, 2004
Sold by
Pancake Clifford W
Bought by
Lozano and Yolanda
Current Estimated Value
Home Financials for this Owner
Home Financials are based on the most recent Mortgage that was taken out on this home.
Original Mortgage
$188,800
Interest Rate
5.66%
Purchase Details
Closed on
Oct 30, 2000
Sold by
Hunter Willis L
Bought by
Pancake Clifford & Clara A
Create a Home Valuation Report for This Property
The Home Valuation Report is an in-depth analysis detailing your home's value as well as a comparison with similar homes in the area
Home Values in the Area
Average Home Value in this Area
Purchase History
| Date | Buyer | Sale Price | Title Company |
|---|---|---|---|
| Lozano | $236,000 | -- | |
| Pancake Clifford & Clara A | $236,000 | -- |
Source: Public Records
Mortgage History
| Date | Status | Borrower | Loan Amount |
|---|---|---|---|
| Closed | Pancake Clifford & Clara A | $188,800 |
Source: Public Records
Tax History Compared to Growth
Tax History
| Year | Tax Paid | Tax Assessment Tax Assessment Total Assessment is a certain percentage of the fair market value that is determined by local assessors to be the total taxable value of land and additions on the property. | Land | Improvement |
|---|---|---|---|---|
| 2025 | $3,258 | $115,175 | $15,000 | $100,175 |
| 2024 | $3,258 | $115,175 | $15,000 | $100,175 |
| 2023 | $2,161 | $115,175 | $15,000 | $100,175 |
| 2022 | $2,958 | $115,175 | $15,000 | $100,175 |
| 2021 | $1,667 | $79,400 | $13,125 | $66,275 |
| 2020 | $1,762 | $79,400 | $13,125 | $66,275 |
| 2019 | $1,762 | $79,400 | $13,125 | $66,275 |
| 2018 | $2,421 | $79,400 | $0 | $0 |
| 2017 | $2,722 | $70,050 | $0 | $0 |
| 2016 | $2,722 | $70,050 | $0 | $0 |
| 2015 | $2,722 | $70,050 | $0 | $0 |
| 2014 | $1,742 | $70,050 | $0 | $0 |
| 2013 | -- | $70,400 | $0 | $0 |
Source: Public Records
Map
Nearby Homes