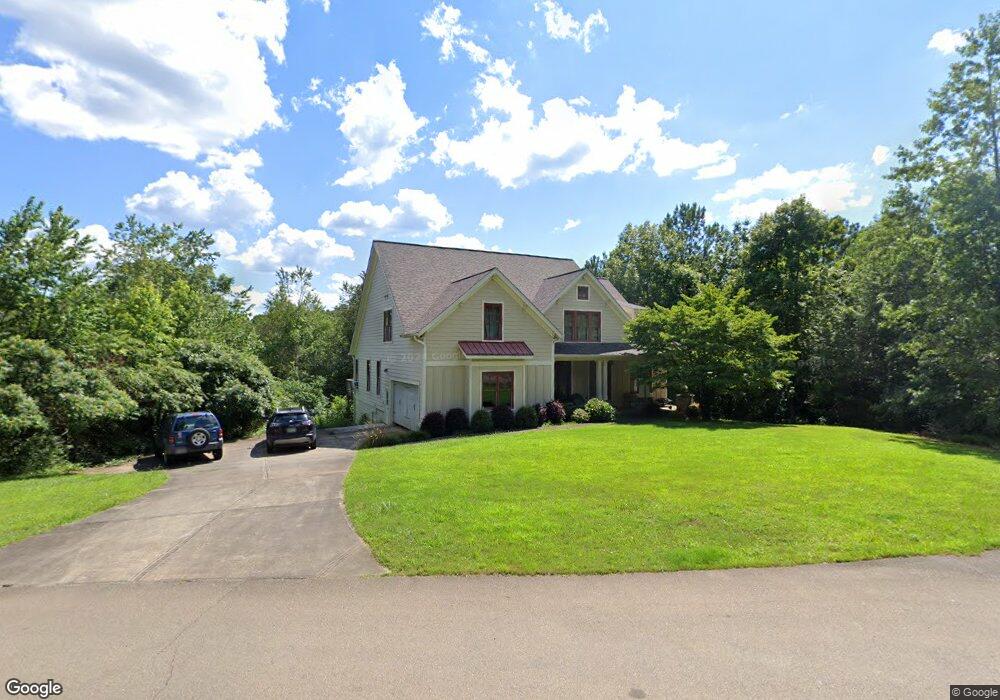
298 Redfield Way Jasper, GA 30143
Estimated Value: $494,126 - $546,000
Studio
4
Baths
2,741
Sq Ft
$189/Sq Ft
Est. Value
About This Home
This home is located at 298 Redfield Way, Jasper, GA 30143 and is currently estimated at $518,532, approximately $189 per square foot. 298 Redfield Way is a home located in Pickens County with nearby schools including Tate Elementary School, Pickens County Middle School, and Pickens County High School.
Ownership History
Date
Name
Owned For
Owner Type
Purchase Details
Closed on
Mar 25, 2021
Sold by
Oak Leaf Developers Llc
Bought by
Frierson James W and Frierson Bonnie D
Current Estimated Value
Home Financials for this Owner
Home Financials are based on the most recent Mortgage that was taken out on this home.
Original Mortgage
$357,947
Outstanding Balance
$319,811
Interest Rate
2.9%
Mortgage Type
VA
Estimated Equity
$198,721
Purchase Details
Closed on
Nov 19, 2018
Sold by
Fultz Timothy J
Bought by
Byerly Timothy and Byerly Mary Beth
Purchase Details
Closed on
Oct 26, 2013
Sold by
Klinger Dan A
Bought by
Fultz Belinda J
Purchase Details
Closed on
Feb 20, 2007
Sold by
Three J Properties Llc
Bought by
Oak Leaf Developers Llc
Purchase Details
Closed on
Jan 31, 2005
Sold by
Locke Fred A
Bought by
Spence Jayne L
Purchase Details
Closed on
May 28, 2004
Bought by
Three J Properties Llc
Create a Home Valuation Report for This Property
The Home Valuation Report is an in-depth analysis detailing your home's value as well as a comparison with similar homes in the area
Home Values in the Area
Average Home Value in this Area
Purchase History
| Date | Buyer | Sale Price | Title Company |
|---|---|---|---|
| Frierson James W | $349,900 | -- | |
| Frierson James W | -- | -- | |
| Byerly Timothy | $28,000 | -- | |
| Fultz Belinda J | $23,500 | -- | |
| Oak Leaf Developers Llc | $35,000 | -- | |
| Spence Jayne L | -- | -- | |
| Three J Properties Llc | $731,000 | -- | |
| Wigington Bob | -- | -- |
Source: Public Records
Mortgage History
| Date | Status | Borrower | Loan Amount |
|---|---|---|---|
| Open | Frierson James W | $357,947 |
Source: Public Records
Tax History
| Year | Tax Paid | Tax Assessment Tax Assessment Total Assessment is a certain percentage of the fair market value that is determined by local assessors to be the total taxable value of land and additions on the property. | Land | Improvement |
|---|---|---|---|---|
| 2025 | $3,431 | $189,452 | $14,000 | $175,452 |
| 2024 | $3,749 | $189,452 | $14,000 | $175,452 |
| 2023 | $2,754 | $135,409 | $14,000 | $121,409 |
| 2022 | $2,754 | $135,409 | $14,000 | $121,409 |
| 2021 | $2,950 | $135,409 | $14,000 | $121,409 |
| 2020 | $3,039 | $135,409 | $14,000 | $121,409 |
| 2019 | $3,109 | $135,409 | $14,000 | $121,409 |
| 2018 | $3,138 | $135,409 | $14,000 | $121,409 |
| 2017 | $3,189 | $135,409 | $14,000 | $121,409 |
| 2016 | $3,240 | $135,409 | $14,000 | $121,409 |
| 2015 | $3,165 | $135,409 | $14,000 | $121,409 |
| 2014 | $3,171 | $135,409 | $14,000 | $121,409 |
| 2013 | -- | $135,409 | $14,000 | $121,409 |
Source: Public Records
Map
Nearby Homes
- Lot 178 Vista Creek Dr
- Lot 178 Vista Creek Dr Unit 178
- 85 Mauser Ct
- 28 Hood Park Ct
- 173 Hood Park Ct
- 91 Smith and Wesson Way
- 71 Hood Park Ct
- 65 Hood Park Ct
- 0 Redfield Way Unit 7714926
- 378 Hood Park Dr
- 341 Hood Park Dr
- 0 Mauser Ct Unit 10667385
- 0 Mauser Ct Unit 7715064
- 0 Mauser Ct Unit 10686076
- 0 Mauser Ct Unit 7700325
- 76 Remington Ln
- 800 Browning Way
- 850 Browning Way
- 710 Lumber Company Rd
- 733 Gennett Dr
- 312 Redfield Way
- 20 Ithica Ct
- 0 Ithica Ct Unit 10576194
- 0 Ithica Ct Unit 270 10041728
- 0 Ithica Ct Unit 271 10041729
- 0 Ithica Ct Unit 7035289
- 0 Ithica Court 270 Unit 7035282
- 255 Redfield Way
- 238 Redfield Way
- 114 Springfield Ct
- 30 Redfield Ct
- 205 Springfield Ct
- 207 Redfield Way
- 198 Redfield Way
- 198 Redfield Way Unit 72
- 29 Redfield Ct
- 218 Redfield Way
- 190 Redfield Way
- 181 Redfield Way
- 240 Redfield Way
Your Personal Tour Guide
Ask me questions while you tour the home.