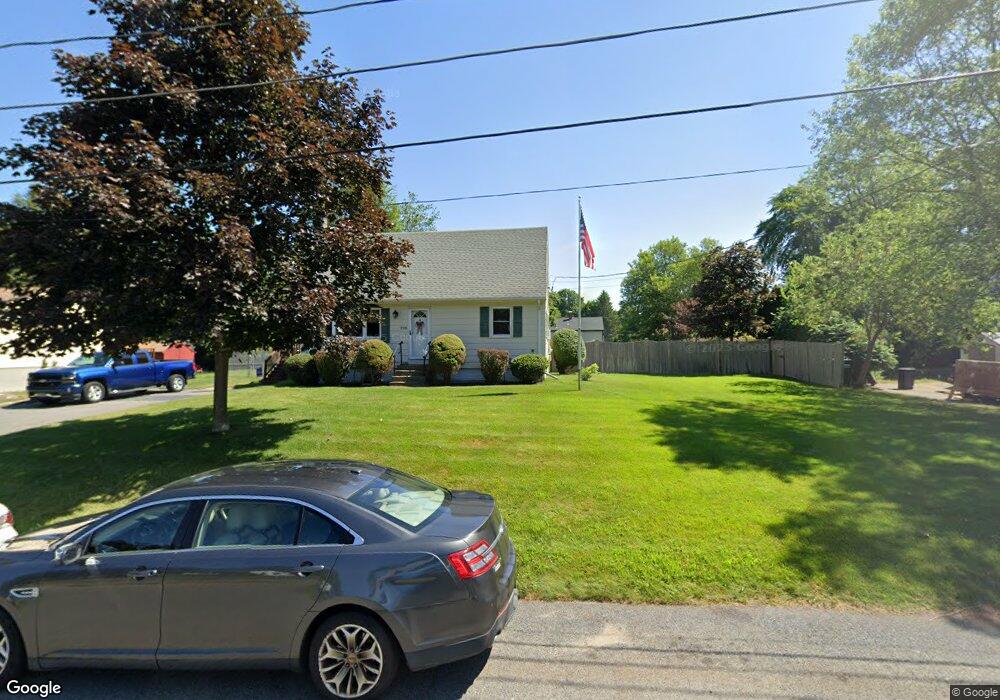
298 Temi Rd Raynham, MA 02767
Estimated Value: $520,718 - $583,000
4
Beds
2
Baths
1,344
Sq Ft
$416/Sq Ft
Est. Value
About This Home
This home is located at 298 Temi Rd, Raynham, MA 02767 and is currently estimated at $559,180, approximately $416 per square foot. 298 Temi Rd is a home located in Bristol County with nearby schools including Merrill Elementary School, LaLiberte Elementary School, and Williams Intermediate School.
Ownership History
Date
Name
Owned For
Owner Type
Purchase Details
Closed on
Aug 28, 2003
Sold by
Cumiskey Gary R and Cumiskey Heidi Farcas
Bought by
Omalley Stephen E and Omalley Kelly S
Current Estimated Value
Home Financials for this Owner
Home Financials are based on the most recent Mortgage that was taken out on this home.
Original Mortgage
$244,000
Outstanding Balance
$105,274
Interest Rate
5.69%
Mortgage Type
Purchase Money Mortgage
Estimated Equity
$453,906
Purchase Details
Closed on
Jul 23, 1997
Sold by
Morin Peter D and Morin Carolyn J
Bought by
Cumiskey Gary R and Farcas-Cumiskey Heidi
Home Financials for this Owner
Home Financials are based on the most recent Mortgage that was taken out on this home.
Original Mortgage
$126,000
Interest Rate
7.7%
Mortgage Type
Purchase Money Mortgage
Create a Home Valuation Report for This Property
The Home Valuation Report is an in-depth analysis detailing your home's value as well as a comparison with similar homes in the area
Home Values in the Area
Average Home Value in this Area
Purchase History
| Date | Buyer | Sale Price | Title Company |
|---|---|---|---|
| Omalley Stephen E | $305,000 | -- | |
| Cumiskey Gary R | $140,000 | -- |
Source: Public Records
Mortgage History
| Date | Status | Borrower | Loan Amount |
|---|---|---|---|
| Open | Omalley Stephen E | $244,000 | |
| Previous Owner | Cumiskey Gary R | $123,000 | |
| Previous Owner | Cumiskey Gary R | $126,000 | |
| Previous Owner | Cumiskey Gary R | $131,000 |
Source: Public Records
Tax History
| Year | Tax Paid | Tax Assessment Tax Assessment Total Assessment is a certain percentage of the fair market value that is determined by local assessors to be the total taxable value of land and additions on the property. | Land | Improvement |
|---|---|---|---|---|
| 2025 | $5,220 | $431,400 | $207,600 | $223,800 |
| 2024 | $4,979 | $400,900 | $188,800 | $212,100 |
| 2023 | $4,835 | $355,500 | $169,900 | $185,600 |
| 2022 | $4,738 | $319,500 | $160,400 | $159,100 |
| 2021 | $6,490 | $304,200 | $151,000 | $153,200 |
| 2020 | $4,242 | $294,400 | $143,500 | $150,900 |
| 2019 | $3,701 | $284,900 | $134,000 | $150,900 |
| 2018 | $3,938 | $264,300 | $126,500 | $137,800 |
| 2017 | $3,060 | $247,900 | $120,800 | $127,100 |
| 2016 | $3,657 | $244,100 | $117,000 | $127,100 |
| 2015 | $3,557 | $233,400 | $122,000 | $111,400 |
Source: Public Records
Map
Nearby Homes
- 30 Edward Rd
- 53 Queens Cir
- 21 Sully Rd
- 68 Michael Rd
- 935 King St
- 173 Titicut Rd
- 75 Warren St W Unit 16
- 224 Whippoorwill Dr
- 35 Spruce St
- 152 Forgeriver
- 84 Diniz Dr
- 30 Spruce St
- 0 Cape Highway Route 44 Unit 73474847
- 5 Parcels Cape Highway Route 44
- 208 S Main St
- 858 Pine St Unit Model
- 4-B High Ridge Dr
- 698 Pine St
- 2 Maplewood Ln Unit 21-1
- 0 Maplewood Unit 21.3 73426136
Your Personal Tour Guide
Ask me questions while you tour the home.