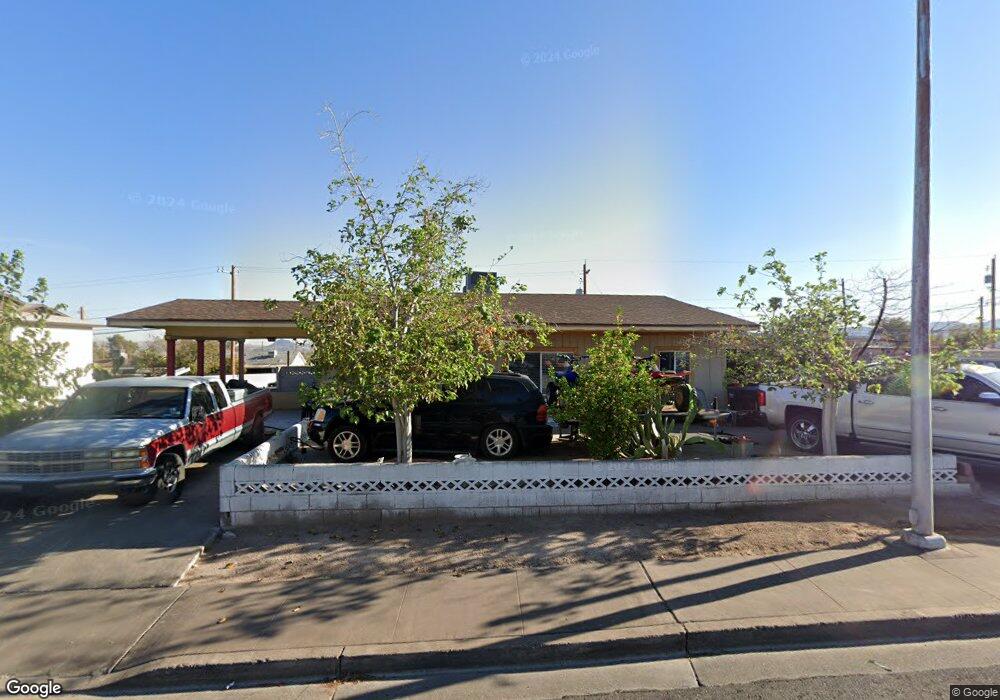
298 W Basic Rd Henderson, NV 89015
Downtown Henderson NeighborhoodEstimated Value: $312,000 - $357,000
3
Beds
1
Bath
1,368
Sq Ft
$238/Sq Ft
Est. Value
About This Home
This home is located at 298 W Basic Rd, Henderson, NV 89015 and is currently estimated at $325,844, approximately $238 per square foot. 298 W Basic Rd is a home located in Clark County with nearby schools including Robert L Taylor Elementary School, B Mahlon Brown Academy of International Studies, and Foothill High School.
Ownership History
Date
Name
Owned For
Owner Type
Purchase Details
Closed on
Jun 2, 2021
Sold by
Zepeda Rosario M and Zepeda Rozario M
Bought by
Zepeda Rosaria M and Zepeda Teresa
Current Estimated Value
Purchase Details
Closed on
Apr 22, 2002
Sold by
Zepeda Teresa C
Bought by
Zepeda Rosario M
Home Financials for this Owner
Home Financials are based on the most recent Mortgage that was taken out on this home.
Original Mortgage
$118,146
Outstanding Balance
$47,911
Interest Rate
7.08%
Mortgage Type
FHA
Estimated Equity
$277,933
Purchase Details
Closed on
Apr 19, 2002
Sold by
Ennis Dawn
Bought by
Zepeda Rozario M
Home Financials for this Owner
Home Financials are based on the most recent Mortgage that was taken out on this home.
Original Mortgage
$118,146
Outstanding Balance
$47,911
Interest Rate
7.08%
Mortgage Type
FHA
Estimated Equity
$277,933
Purchase Details
Closed on
Aug 31, 2001
Sold by
Crisp James D and Barker Bob W
Bought by
Ennis Dawn
Create a Home Valuation Report for This Property
The Home Valuation Report is an in-depth analysis detailing your home's value as well as a comparison with similar homes in the area
Home Values in the Area
Average Home Value in this Area
Purchase History
| Date | Buyer | Sale Price | Title Company |
|---|---|---|---|
| Zepeda Rosaria M | -- | Title Deeds Needs Llc | |
| Zepeda Rosario M | -- | First American Title Co | |
| Zepeda Rozario M | $120,000 | First American Title Co | |
| Ennis Dawn | $72,000 | First American Title Co |
Source: Public Records
Mortgage History
| Date | Status | Borrower | Loan Amount |
|---|---|---|---|
| Open | Zepeda Rozario M | $118,146 |
Source: Public Records
Tax History
| Year | Tax Paid | Tax Assessment Tax Assessment Total Assessment is a certain percentage of the fair market value that is determined by local assessors to be the total taxable value of land and additions on the property. | Land | Improvement |
|---|---|---|---|---|
| 2026 | $503 | $43,789 | $27,563 | $16,226 |
| 2025 | $488 | $38,166 | $22,050 | $16,116 |
| 2024 | $474 | $38,166 | $22,050 | $16,116 |
| 2023 | $474 | $38,046 | $23,450 | $14,596 |
| 2022 | $460 | $33,327 | $20,300 | $13,027 |
| 2021 | $467 | $32,429 | $20,300 | $12,129 |
| 2020 | $431 | $29,983 | $18,200 | $11,783 |
| 2019 | $387 | $24,094 | $13,300 | $10,794 |
| 2018 | $370 | $23,372 | $13,300 | $10,072 |
| 2017 | $594 | $20,477 | $10,500 | $9,977 |
| 2016 | $347 | $17,051 | $7,350 | $9,701 |
| 2015 | $345 | $14,315 | $4,900 | $9,415 |
| 2014 | $335 | $11,225 | $4,900 | $6,325 |
Source: Public Records
Map
Nearby Homes
- 254 W Basic Rd
- 247 Tungsten St
- 234 W Basic Rd
- 126 Magnesium St
- 211 W Atlantic Ave
- 206 W Atlantic Ave
- 119 Manganese St
- 23 Magnesium St
- 203 W Pacific Ave
- 111 Copper St
- 211 Viewmont Dr
- 119 E van Wagenen St
- 405 Box Elder Way
- 256 Hillcrest Dr
- 603 Buchanan Ave
- 403 Leighann Rd
- 434 Crestway Rd
- 15 Washington Way
- 1 S Water St
- 230 W Rochell Dr
- 294 W Basic Rd
- 290 W Basic Rd
- 302 W Basic Rd
- 302 W Basic Rd Unit 8
- 302 W Basic Rd
- 291 Tungsten St
- 295 W Basic Rd
- 303 Tungsten St
- 297 W Basic Rd
- 297 W Basic Rd
- 293 W Basic Rd
- 286 W Basic Rd
- 307 Tungsten St
- 299 W Basic Rd
- 291 W Basic Rd
- 306 W Basic Rd
- 287 Tungsten St
- 301 W Basic Rd
- 287 W Basic Rd
- 311 Tungsten St
Your Personal Tour Guide
Ask me questions while you tour the home.