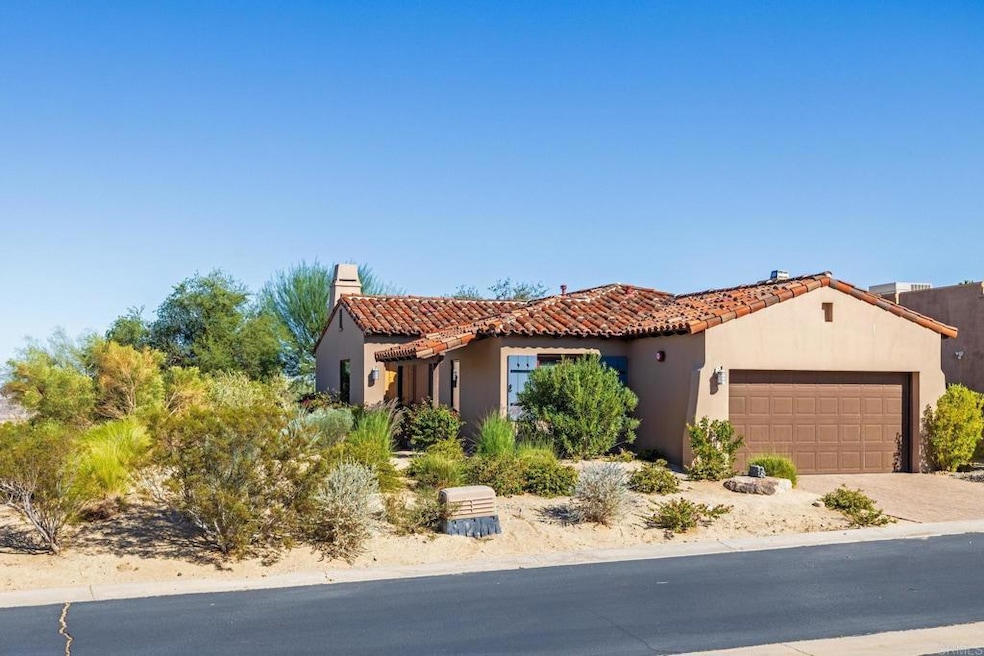
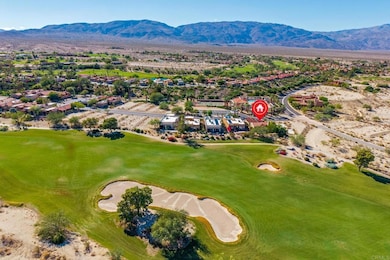

2980 Fonts Point Dr Borrego Springs, CA 92004
Estimated payment $2,857/month
Highlights
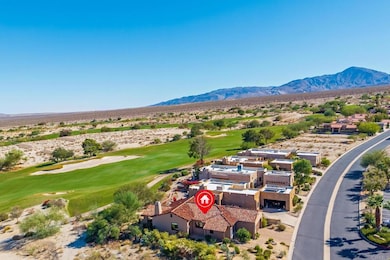
- On Golf Course
- Wood Flooring
- Tennis Courts
- Heated Lap Pool
- Main Floor Bedroom
- Hiking Trails
About This Home
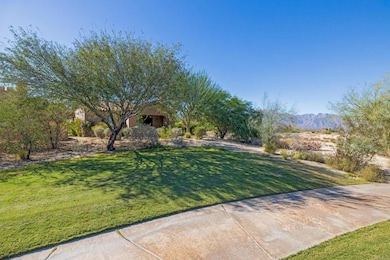
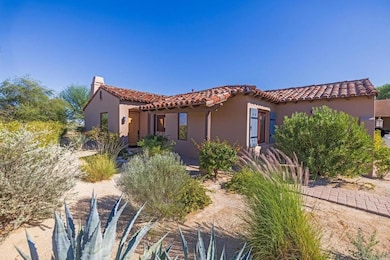
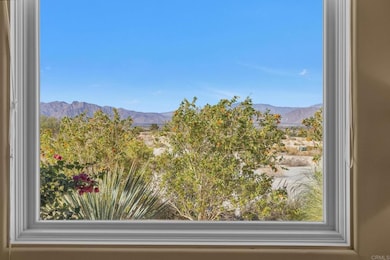
Enjoy resort-style living in this single-level, turn-key 2 bedroom, 2 bath home perfectly situated on the 14th Fairway of Rams Hill Golf Course. This desirable location offers sweeping mountain, golf course, and desert views with stunning sunrises and sunsets. The open floor plan features updated finishes and a bright, inviting interior designed for easy living. Just steps to the clubhouse, community pool, spa, tennis, and pickleball courts—ideal for both relaxation and recreation. Adjacent to Anza-Borrego Desert State Park, this property is a haven for nature lovers offering endless hiking, biking, and jeeping adventures, plus world-class stargazing in Borrego’s designated Dark Sky Community.
Listing Agent
Willis Allen Real Estate Brokerage Email: connieberkley@gmail.com License #00850524 Listed on: 10/25/2025

Home Details
Home Type
- Single Family
Year Built
- Built in 2011
Lot Details
- 6,534 Sq Ft Lot
- On Golf Course
- Rural Setting
- Desert faces the back of the property
- Density is up to 1 Unit/Acre
- Property is zoned R-1:SINGLE FAM-RES
HOA Fees
- $857 Monthly HOA Fees
Parking
- 2 Car Attached Garage
Property Views
- Golf Course
- Mountain
- Desert
Home Design
- Entry on the 1st floor
- Turnkey
- Planned Development
Interior Spaces
- 1,373 Sq Ft Home
- 1-Story Property
- Living Room with Fireplace
- Laundry Room
Flooring
- Wood
- Carpet
- Laminate
Bedrooms and Bathrooms
- 2 Main Level Bedrooms
- 2 Full Bathrooms
Pool
- Heated Lap Pool
- Heated In Ground Pool
- Heated Spa
- In Ground Spa
- Pool Heated Passively
Utilities
- Central Air
- No Heating
Listing and Financial Details
- Tax Tract Number 11235
- Assessor Parcel Number 2003113800
Community Details
Overview
- Front Yard Maintenance
- Rams Hill Community Association, Phone Number (760) 767-1158
- Santa Fe
- Maintained Community
Recreation
- Golf Course Community
- Tennis Courts
- Pickleball Courts
- Community Pool
- Community Spa
- Hiking Trails
- Bike Trail
Additional Features
- Community Barbecue Grill
- Controlled Access
Map
Home Values in the Area
Average Home Value in this Area
Tax History
| Year | Tax Paid | Tax Assessment Tax Assessment Total Assessment is a certain percentage of the fair market value that is determined by local assessors to be the total taxable value of land and additions on the property. | Land | Improvement |
|---|---|---|---|---|
| 2025 | $2,660 | $172,388 | $49,250 | $123,138 |
| 2024 | $2,660 | $169,009 | $48,285 | $120,724 |
| 2023 | $2,688 | $165,696 | $47,339 | $118,357 |
| 2022 | $2,639 | $162,448 | $46,411 | $116,037 |
| 2021 | $2,656 | $159,263 | $45,501 | $113,762 |
| 2020 | $2,654 | $157,631 | $45,035 | $112,596 |
| 2019 | $2,510 | $154,541 | $44,152 | $110,389 |
| 2018 | $2,484 | $151,512 | $43,287 | $108,225 |
| 2017 | $2,469 | $148,542 | $42,439 | $106,103 |
| 2016 | $2,433 | $145,630 | $41,607 | $104,023 |
| 2015 | $2,404 | $143,444 | $40,983 | $102,461 |
| 2014 | $2,370 | $140,635 | $40,181 | $100,454 |
Property History
| Date | Event | Price | List to Sale | Price per Sq Ft |
|---|---|---|---|---|
| 10/25/2025 10/25/25 | For Sale | $339,000 | -- | $247 / Sq Ft |
Purchase History
| Date | Type | Sale Price | Title Company |
|---|---|---|---|
| Grant Deed | $140,000 | Stewart Title Of California | |
| Grant Deed | -- | Accommodation | |
| Grant Deed | -- | Advantage Title | |
| Quit Claim Deed | -- | Chicago Title | |
| Grant Deed | -- | Chicago Title | |
| Grant Deed | -- | Chicago Title |
Source: California Regional Multiple Listing Service (CRMLS)
MLS Number: NDP2510283
APN: 200-311-38
Disclaimer: Certain information contained herein is derived from information provided by parties other than Homes.com. All information provided is deemed reliable, but is not guaranteed to be accurate and should be independently verified.
![]() The multiple listing data appearing on this website, or contained in reports produced therefrom, is owned and copyrighted by California Regional Multiple Listing Service, Inc. ("CRMLS") and is protected by all applicable copyright laws. Information provided is for viewer's personal, non-commercial use and may not be used for any purpose other than to identify prospective properties the viewer may be interested in purchasing. All listing data, including but not limited to square footage and lot size is believed to be accurate, but the listing Agent, listing Broker and CRMLS and its affiliates do not warrant or guarantee such accuracy. The viewer should independently verify the listed data prior to making any decisions based on such information by personal inspection and/or contacting a real estate professional.
The multiple listing data appearing on this website, or contained in reports produced therefrom, is owned and copyrighted by California Regional Multiple Listing Service, Inc. ("CRMLS") and is protected by all applicable copyright laws. Information provided is for viewer's personal, non-commercial use and may not be used for any purpose other than to identify prospective properties the viewer may be interested in purchasing. All listing data, including but not limited to square footage and lot size is believed to be accurate, but the listing Agent, listing Broker and CRMLS and its affiliates do not warrant or guarantee such accuracy. The viewer should independently verify the listed data prior to making any decisions based on such information by personal inspection and/or contacting a real estate professional.
Based on information from California Regional Multiple Listing Service, Inc. and /or other sources. All data, including all measurements and calculations of area, is obtained from various sources and has not been, and will not be, verified by broker or MLS. All information should be independently reviewed and verified for accuracy. Properties may or may not be listed by the office/agent presenting the information
- 2842 Fonts Point Dr
- 0 Roadrunner Dr S Unit NDP2408923
- 0 Roadrunner Dr S Unit NDP2408891
- 0 Roadrunner Dr S Unit 180056176
- 0 Roadrunner Dr S Unit NDP2408931
- 0 Roadrunner Dr S Unit NDP2408926
- 4728 Desert Vista Dr
- 4715 Desert Vista Dr
- 4604 Desert Vista Dr
- 1977 Desert Vista Terrace
- 1969 Desert Vista Terrace
- 1921 Desert Vista Terrace
- 4949 Desert Vista Dr
- 2122 Rams Hill Dr
- 0 Ironwood Ln Unit NDP2408889
- 1831 Hunter Dr
- 0 Hunter Dr Unit 180056004
- 0 Hunter Dr Unit NDP2508112
- 0 Rams Hill Dr Unit NDP2510654
- 1638 Las Casitas Dr