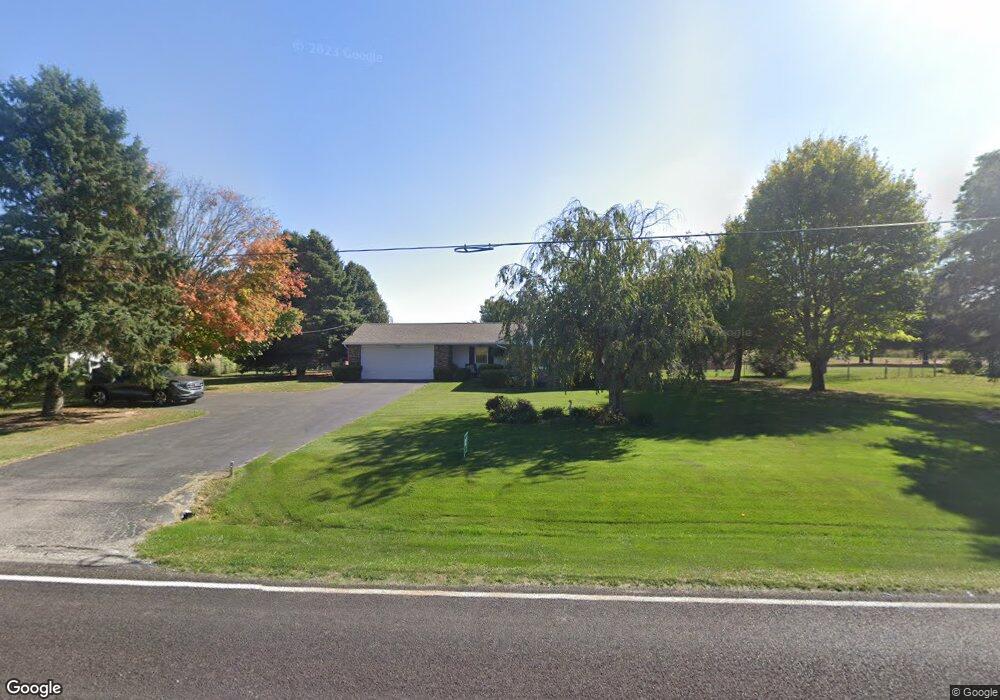
2980 Old Clifton Rd Springfield, OH 45502
Estimated Value: $274,000 - $350,000
3
Beds
2
Baths
1,657
Sq Ft
$186/Sq Ft
Est. Value
About This Home
This home is located at 2980 Old Clifton Rd, Springfield, OH 45502 and is currently estimated at $307,767, approximately $185 per square foot. 2980 Old Clifton Rd is a home located in Clark County with nearby schools including Shawnee Middle School/High School, Springfield Preparatory & Fitness Academy, and Risen Christ Lutheran School.
Ownership History
Date
Name
Owned For
Owner Type
Purchase Details
Closed on
Oct 16, 2019
Sold by
Lucas Jo E and Thornton Jo E
Bought by
Lucas Jo E and Lucas Mark T
Current Estimated Value
Home Financials for this Owner
Home Financials are based on the most recent Mortgage that was taken out on this home.
Original Mortgage
$135,750
Interest Rate
3.7%
Mortgage Type
New Conventional
Purchase Details
Closed on
Jun 16, 2010
Sold by
Kovaleski Terry L and Kovaleski Cheryl A
Bought by
Thornton Jo E
Home Financials for this Owner
Home Financials are based on the most recent Mortgage that was taken out on this home.
Original Mortgage
$158,650
Interest Rate
4.97%
Mortgage Type
New Conventional
Purchase Details
Closed on
Jun 1, 1984
Sold by
Perkins Perkins C C and Perkins Leona P
Bought by
Kovaleski Terry L and Kovaleski Cheryl A
Create a Home Valuation Report for This Property
The Home Valuation Report is an in-depth analysis detailing your home's value as well as a comparison with similar homes in the area
Home Values in the Area
Average Home Value in this Area
Purchase History
| Date | Buyer | Sale Price | Title Company |
|---|---|---|---|
| Lucas Jo E | -- | None Available | |
| Thornton Jo E | $167,000 | Attorney | |
| Kovaleski Terry L | $59,800 | -- |
Source: Public Records
Mortgage History
| Date | Status | Borrower | Loan Amount |
|---|---|---|---|
| Previous Owner | Lucas Jo E | $135,750 | |
| Previous Owner | Thornton Jo E | $158,650 |
Source: Public Records
Tax History Compared to Growth
Tax History
| Year | Tax Paid | Tax Assessment Tax Assessment Total Assessment is a certain percentage of the fair market value that is determined by local assessors to be the total taxable value of land and additions on the property. | Land | Improvement |
|---|---|---|---|---|
| 2024 | $3,734 | $76,270 | $12,420 | $63,850 |
| 2023 | $3,734 | $76,270 | $12,420 | $63,850 |
| 2022 | $3,703 | $76,270 | $12,420 | $63,850 |
| 2021 | $3,208 | $59,130 | $9,630 | $49,500 |
| 2020 | $3,233 | $59,130 | $9,630 | $49,500 |
| 2019 | $3,282 | $59,130 | $9,630 | $49,500 |
| 2018 | $2,919 | $51,930 | $8,750 | $43,180 |
| 2017 | $2,996 | $51,930 | $8,750 | $43,180 |
| 2016 | $2,717 | $51,930 | $8,750 | $43,180 |
| 2015 | $2,706 | $50,271 | $8,750 | $41,521 |
| 2014 | $2,713 | $50,271 | $8,750 | $41,521 |
| 2013 | $2,358 | $50,271 | $8,750 | $41,521 |
Source: Public Records
Map
Nearby Homes
- 3142 Old Clifton Rd
- 2747 Lonesome Dove Ln W
- 758 Oneida Dr
- 711 Kinnane Ave
- 431 Lyle Ave
- 421 Lyle Ave
- 201 Kinnane Ave
- 2855 Springfield Jamestown Rd
- Holcombe Plan at Sycamore Ridge
- Newcastle Plan at Sycamore Ridge
- Pendleton Plan at Sycamore Ridge
- Bellamy Plan at Sycamore Ridge
- Harmony Plan at Sycamore Ridge
- 4041 Selma Rd
- 4041 Selma Pike
- 2216 Hackberry St
- 2209 Memorial Dr
- 1832 Victory Dr
- 1630 S Sweetbriar Ln
- 2200 Wrenwood Rd
- 2970 Old Clifton Rd
- 2960 Old Clifton Rd
- 3024 Old Clifton Rd
- 2900 Old Clifton Rd
- 1008 Tioga Ct
- 3066 Old Clifton Rd
- 2880 Old Clifton Rd
- 1012 Tioga Ct
- 1005 Tioga Ct
- 2860 Old Clifton Rd
- 3108 Old Clifton Rd
- 1016 Tioga Ct
- 1011 Tioga Ct
- 2877 Old Clifton Rd
- 2840 Old Clifton Rd
- 2823 Old Clifton Rd
- 1028 Tioga Ct
- 1021 Tioga Ct
- 3174 Old Clifton Rd
- 970 Timberview Ave