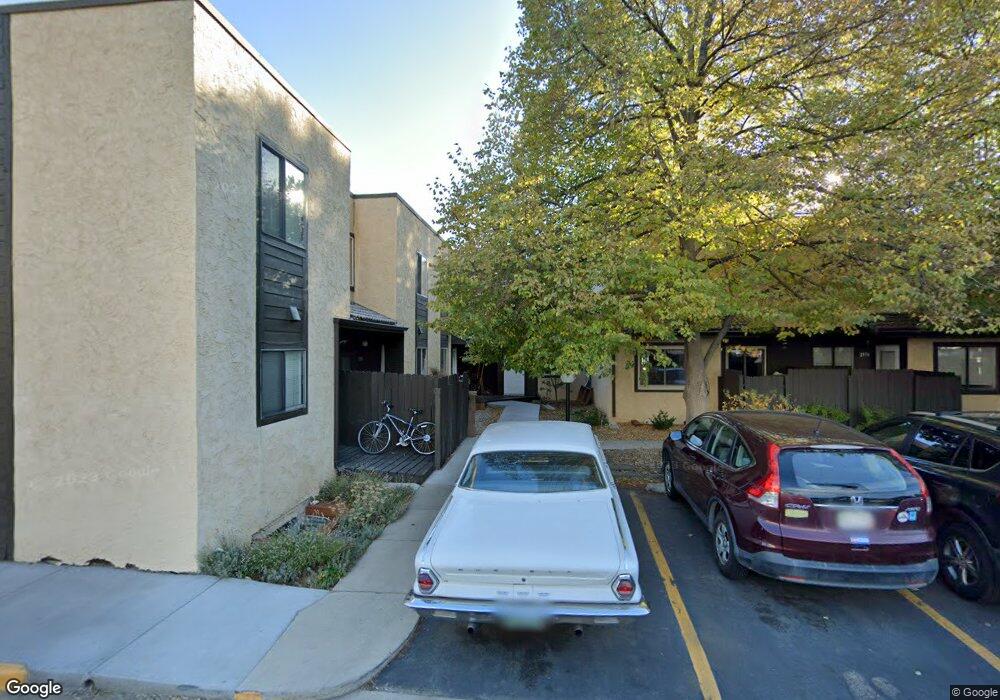
2980 Shady Hollow W Unit B4 Boulder, CO 80304
Crossroads NeighborhoodEstimated Value: $565,340 - $668,000
3
Beds
2
Baths
1,577
Sq Ft
$384/Sq Ft
Est. Value
About This Home
This home is located at 2980 Shady Hollow W Unit B4, Boulder, CO 80304 and is currently estimated at $605,085, approximately $383 per square foot. 2980 Shady Hollow W Unit B4 is a home located in Boulder County with nearby schools including Columbine Elementary School, Casey Middle School, and Boulder High School.
Ownership History
Date
Name
Owned For
Owner Type
Purchase Details
Closed on
Sep 28, 2007
Sold by
Siemann Vera J
Bought by
Peters Thomas R
Current Estimated Value
Home Financials for this Owner
Home Financials are based on the most recent Mortgage that was taken out on this home.
Original Mortgage
$260,100
Outstanding Balance
$165,259
Interest Rate
6.55%
Mortgage Type
Purchase Money Mortgage
Estimated Equity
$439,826
Purchase Details
Closed on
Aug 17, 1994
Sold by
Siemann Christopher L
Bought by
Siemann Cecil L
Home Financials for this Owner
Home Financials are based on the most recent Mortgage that was taken out on this home.
Original Mortgage
$126,000
Interest Rate
8.69%
Purchase Details
Closed on
Dec 11, 1980
Bought by
Peters Thomas R and Peters Lillian J
Purchase Details
Closed on
Apr 4, 1979
Bought by
Peters Thomas R and Peters Lillian J
Create a Home Valuation Report for This Property
The Home Valuation Report is an in-depth analysis detailing your home's value as well as a comparison with similar homes in the area
Home Values in the Area
Average Home Value in this Area
Purchase History
| Date | Buyer | Sale Price | Title Company |
|---|---|---|---|
| Peters Thomas R | $289,000 | Land Title | |
| Siemann Cecil L | $157,500 | -- | |
| Peters Thomas R | $92,300 | -- | |
| Peters Thomas R | -- | -- |
Source: Public Records
Mortgage History
| Date | Status | Borrower | Loan Amount |
|---|---|---|---|
| Open | Peters Thomas R | $260,100 | |
| Previous Owner | Siemann Cecil L | $126,000 |
Source: Public Records
Tax History Compared to Growth
Tax History
| Year | Tax Paid | Tax Assessment Tax Assessment Total Assessment is a certain percentage of the fair market value that is determined by local assessors to be the total taxable value of land and additions on the property. | Land | Improvement |
|---|---|---|---|---|
| 2025 | $2,813 | $38,982 | $22,288 | $16,694 |
| 2024 | $2,813 | $38,982 | $22,288 | $16,694 |
| 2023 | $2,764 | $38,706 | $23,504 | $18,887 |
| 2022 | $2,709 | $36,119 | $18,626 | $17,493 |
| 2021 | $2,583 | $37,159 | $19,162 | $17,997 |
| 2020 | $2,483 | $35,679 | $17,589 | $18,090 |
| 2019 | $2,445 | $35,679 | $17,589 | $18,090 |
| 2018 | $2,033 | $30,643 | $13,536 | $17,107 |
| 2017 | $2,574 | $33,878 | $14,965 | $18,913 |
| 2016 | $2,208 | $25,512 | $11,781 | $13,731 |
| 2015 | $2,091 | $22,240 | $6,368 | $15,872 |
| 2014 | $1,870 | $22,240 | $6,368 | $15,872 |
Source: Public Records
Map
Nearby Homes
- 2948 Shady Hollow W
- 2707 Valmont Rd Unit 205D
- 2707 Valmont Rd Unit 303C
- 2707 Valmont Rd Unit 304A
- 2707 Valmont Rd Unit 106 Bonus!
- 2530 28th St Unit 118
- 2711 Mapleton Ave Unit 9
- 2711 Mapleton Ave Unit 27
- 2711 Mapleton Ave Unit 1
- 3077 29th St Unit 105
- 2727 Folsom St Unit 303
- 2709 Pine St
- 3160 Folsom St
- 2977 Eagle Way
- 2718 Pine St Unit 305
- 2718 Pine St Unit 301
- 2545 Pine St
- 2595 Glenwood Dr
- 2901 Lorraine Ct
- 3055 23rd St
- 2978 Shady Hollow W Unit B5
- 2982 Shady Hollow W
- 2976 Shady Hollow W
- 2996 Shady Hollow W
- 2994 Shady Hollow W
- 2998 Shady Hollow W
- 2986 Shady Hollow W
- 2974 Shady Hollow W
- 2974 Shady Hollow W Unit 7
- 2992 Shady Hollow W
- 2979 Shady Hollow E
- 2990 Shady Hollow W
- 2990 Shady Hollow W Unit 2
- 2975 Shady Hollow E
- 2975 Shady Hollow E Unit 6
- 2985 Shady Hollow E
- 2989 Shady Hollow E
- 2972 Shady Hollow W Unit 8
- 2988 Shady Hollow W
- 2995 Shady Hollow E