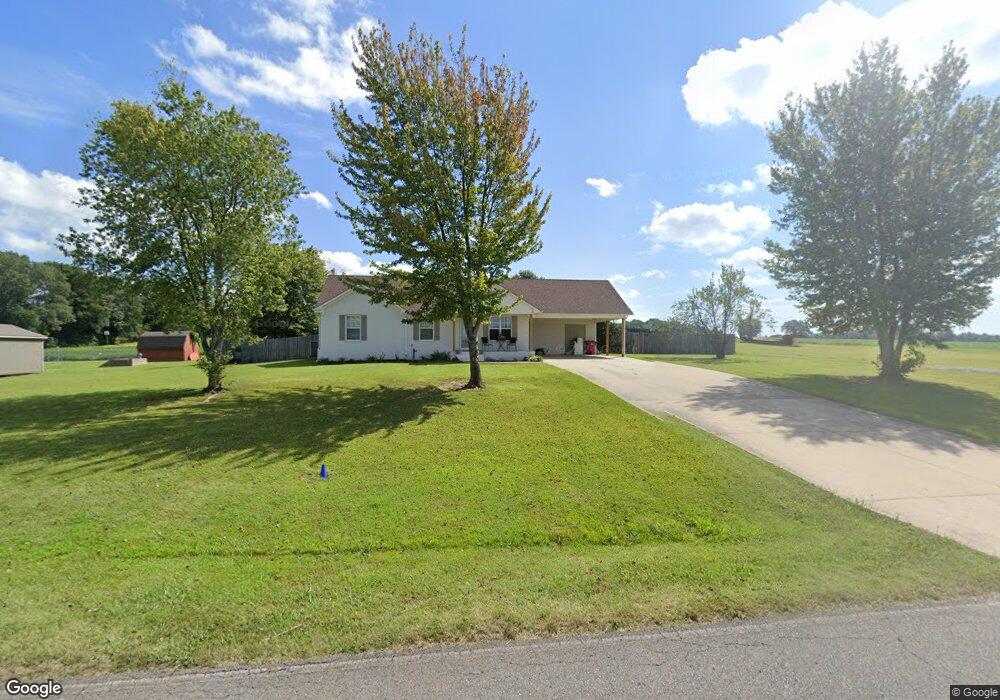
2980 Sharpsferry Rd Newbern, TN 38059
Estimated Value: $209,978 - $274,000
3
Beds
2
Baths
1,292
Sq Ft
$194/Sq Ft
Est. Value
About This Home
This home is located at 2980 Sharpsferry Rd, Newbern, TN 38059 and is currently estimated at $251,245, approximately $194 per square foot. 2980 Sharpsferry Rd is a home located in Dyer County with nearby schools including Trimble Elementary School, Northview Middle School, and Dyer County High School.
Ownership History
Date
Name
Owned For
Owner Type
Purchase Details
Closed on
Dec 14, 2021
Sold by
Petrie Danny Lee and Petrie Bethany
Bought by
Baker Aaron S and Baker Amy R
Current Estimated Value
Home Financials for this Owner
Home Financials are based on the most recent Mortgage that was taken out on this home.
Original Mortgage
$197,979
Outstanding Balance
$182,040
Interest Rate
3.09%
Mortgage Type
USDA
Estimated Equity
$69,205
Purchase Details
Closed on
May 18, 2010
Sold by
Johnson Colt
Bought by
Petrie Danny Lee
Home Financials for this Owner
Home Financials are based on the most recent Mortgage that was taken out on this home.
Original Mortgage
$116,280
Interest Rate
5.03%
Purchase Details
Closed on
Oct 28, 2005
Sold by
Autry Michael
Bought by
Johnson Colt and Johnson Veronica
Home Financials for this Owner
Home Financials are based on the most recent Mortgage that was taken out on this home.
Original Mortgage
$74,800
Interest Rate
5.84%
Purchase Details
Closed on
Jul 22, 2003
Create a Home Valuation Report for This Property
The Home Valuation Report is an in-depth analysis detailing your home's value as well as a comparison with similar homes in the area
Home Values in the Area
Average Home Value in this Area
Purchase History
| Date | Buyer | Sale Price | Title Company |
|---|---|---|---|
| Baker Aaron S | $196,000 | Dyer Land Title Company Inc | |
| Petrie Danny Lee | $114,000 | -- | |
| Johnson Colt | $93,500 | -- | |
| -- | $78,600 | -- |
Source: Public Records
Mortgage History
| Date | Status | Borrower | Loan Amount |
|---|---|---|---|
| Open | Baker Aaron S | $197,979 | |
| Previous Owner | -- | $116,280 | |
| Previous Owner | -- | $74,800 |
Source: Public Records
Tax History Compared to Growth
Tax History
| Year | Tax Paid | Tax Assessment Tax Assessment Total Assessment is a certain percentage of the fair market value that is determined by local assessors to be the total taxable value of land and additions on the property. | Land | Improvement |
|---|---|---|---|---|
| 2024 | $812 | $33,000 | $2,125 | $30,875 |
| 2023 | $812 | $33,000 | $2,125 | $30,875 |
| 2022 | $782 | $33,000 | $2,125 | $30,875 |
| 2021 | $782 | $33,000 | $2,125 | $30,875 |
| 2020 | $760 | $33,000 | $2,125 | $30,875 |
| 2019 | $762 | $28,825 | $2,125 | $26,700 |
| 2018 | $762 | $28,825 | $2,125 | $26,700 |
| 2017 | $762 | $28,825 | $2,125 | $26,700 |
| 2016 | $762 | $28,825 | $2,125 | $26,700 |
| 2015 | $721 | $28,825 | $2,125 | $26,700 |
| 2014 | $730 | $29,200 | $2,125 | $27,075 |
Source: Public Records
Map
Nearby Homes
- 314 Palestine Rd
- 1585 Sharps Ferry Rd
- 45 Miller St
- 783 Sharps Ferry Rd
- 0 Locust Grove Rd
- 908 Granite Dr
- 0 Biffle Rd
- 610 N Grayson St
- 310 N Grayson St
- 309 N Grayson St
- 502 E Johnson St
- 404 E Johnson St
- 0 N Quincy St
- 408 E Main St
- 521 E Main St
- 603 E Main St
- 621 E Main St
- 404 W Main St
- 526 W Main St
- 215 Shawnee Cobb Rd
- 2980 Sharpsferry Rd Rd
- 3000 Sharpsferry Rd
- 3000 Sharps Ferry Rd
- 2838 Sharpsferry Rd
- 2802 Sharpsferry Rd
- 3080 Sharpsferry Rd
- 3087 Sharpsferry Rd
- 3299 Sharpsferry Rd
- 400 Maple Hill Rd
- 3301 Sharpsferry Rd
- 3359 Sharpsferry Rd
- 250 Maple Hill Rd
- 278 Maple Hill Rd
- 454 Maple Hill Rd
- Lot 3 Maple Hill Rd
- 0 Maple Hill Rd Unit 202243
- 0 Maple Hill Rd
- 155 Backout Rd
- 751 Tater Hill Rd
- 350 Maple Hill Rd