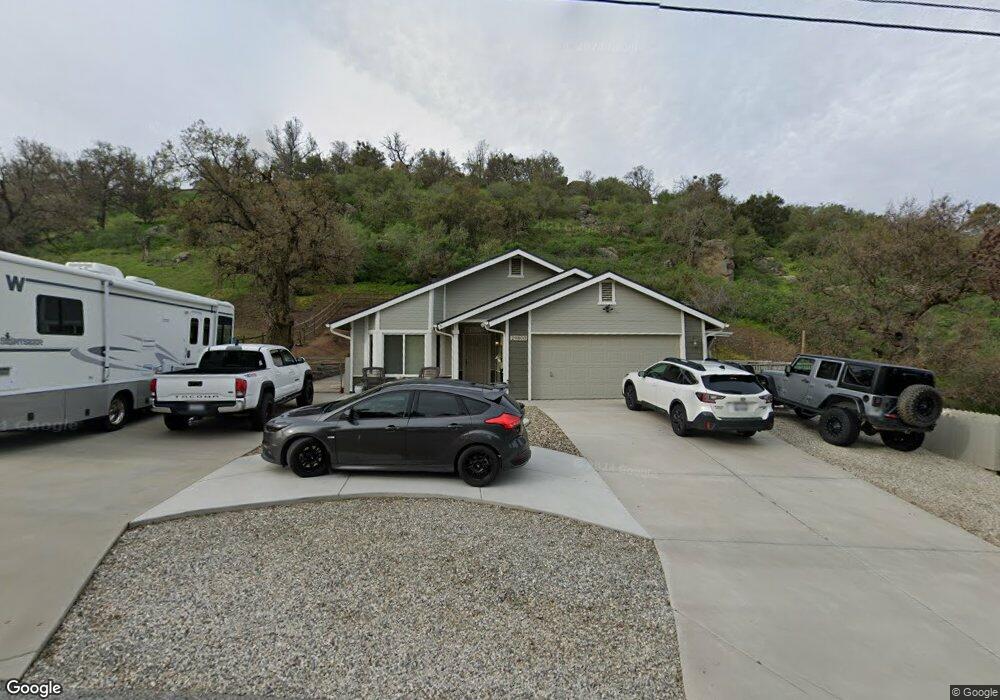
29800 San Joaquin Dr Tehachapi, CA 93561
Estimated Value: $353,253 - $429,000
3
Beds
2
Baths
1,338
Sq Ft
$286/Sq Ft
Est. Value
About This Home
This home is located at 29800 San Joaquin Dr, Tehachapi, CA 93561 and is currently estimated at $382,813, approximately $286 per square foot. 29800 San Joaquin Dr is a home located in Kern County with nearby schools including Cummings Valley Elementary School, Jacobsen Middle School, and Tehachapi High School.
Ownership History
Date
Name
Owned For
Owner Type
Purchase Details
Closed on
Feb 11, 2021
Sold by
Stevens Christopher C and Stevens Vanessa
Bought by
Stevens Christopher C and Stevens Vanessa A
Current Estimated Value
Purchase Details
Closed on
Dec 3, 1998
Sold by
Stevens Christopher C
Bought by
Stevens Christopher C and Stevens Vanessa
Home Financials for this Owner
Home Financials are based on the most recent Mortgage that was taken out on this home.
Original Mortgage
$74,250
Interest Rate
6.63%
Purchase Details
Closed on
Feb 7, 1997
Sold by
Hud
Bought by
Stevens Christopher C
Home Financials for this Owner
Home Financials are based on the most recent Mortgage that was taken out on this home.
Original Mortgage
$71,677
Interest Rate
7.66%
Purchase Details
Closed on
Aug 29, 1996
Sold by
Homeside Lending Inc
Bought by
Hud
Purchase Details
Closed on
Jun 20, 1996
Sold by
Giesler Thomas M and Giesler Coleen A
Bought by
Homeside Lending Inc
Purchase Details
Closed on
May 20, 1994
Sold by
Giesler Thomas M
Bought by
Giesler Coleen A
Create a Home Valuation Report for This Property
The Home Valuation Report is an in-depth analysis detailing your home's value as well as a comparison with similar homes in the area
Home Values in the Area
Average Home Value in this Area
Purchase History
| Date | Buyer | Sale Price | Title Company |
|---|---|---|---|
| Stevens Christopher C | -- | None Available | |
| Stevens Christopher C | -- | Chicago Title Co | |
| Stevens Christopher C | $70,500 | American Title Co | |
| Hud | -- | American Title Co | |
| Homeside Lending Inc | $99,176 | -- | |
| Giesler Coleen A | -- | -- |
Source: Public Records
Mortgage History
| Date | Status | Borrower | Loan Amount |
|---|---|---|---|
| Previous Owner | Stevens Christopher C | $74,250 | |
| Previous Owner | Stevens Christopher C | $71,677 |
Source: Public Records
Tax History Compared to Growth
Tax History
| Year | Tax Paid | Tax Assessment Tax Assessment Total Assessment is a certain percentage of the fair market value that is determined by local assessors to be the total taxable value of land and additions on the property. | Land | Improvement |
|---|---|---|---|---|
| 2025 | $1,562 | $114,301 | $24,414 | $89,887 |
| 2024 | $1,534 | $112,061 | $23,936 | $88,125 |
| 2023 | $1,534 | $109,865 | $23,467 | $86,398 |
| 2022 | $1,498 | $107,711 | $23,007 | $84,704 |
| 2021 | $1,442 | $105,600 | $22,556 | $83,044 |
| 2020 | $1,433 | $104,518 | $22,325 | $82,193 |
| 2019 | $1,421 | $104,518 | $22,325 | $82,193 |
| 2018 | $1,386 | $100,461 | $21,459 | $79,002 |
| 2017 | $1,375 | $98,492 | $21,039 | $77,453 |
| 2016 | $1,294 | $96,562 | $20,627 | $75,935 |
| 2015 | $1,291 | $95,113 | $20,318 | $74,795 |
| 2014 | $1,283 | $93,250 | $19,920 | $73,330 |
Source: Public Records
Map
Nearby Homes
- 0 San Joaquin Dr Unit 9990132
- 0 San Joaquin Dr Unit 9991325
- 0 San Joaquin Dr Unit 202512430
- 29661 Alejandro Ct
- 8 Horsethief Dr
- 29990 Horsethief Dr
- 18750 Alameda Place
- 0 Alameda Place
- 0 Arvin Ct Unit 9992477
- 18671 Buckeye Place
- 0 Buckeye Place Unit 202411029
- 29300 Elkhorn Place
- 18551 Jacks Hill Rd
- 18571 Glenview Ct
- 18780 Jacks Hill Rd
- Lot 50 Caparell Ct
- 30400 Horsethief Dr
- 30300 Piebald Ct
- 0 Horsethief Dr Unit SR24180929
- 18720 Wringfoot Place
- 31735007 Kern Ct
- 29801 San Joaquin Dr
- 29750 Alejandro Ct
- 0 San Joaquin Rd Dr
- 0 Alejandro Ct Unit 11 250023917
- 0 Alejandro Ct Unit 9956735
- 0 Alejandro Ct Unit 9956820
- 0 Alejandro Ct Unit 9957771
- 0 Alejandro Ct Unit 21705179
- 0 Alejandro Ct Unit 9959498
- 0 Alejandro Ct Unit 9959686
- 0 Alejandro Ct Unit 9960625
- 0 Alejandro Ct Unit 9960675
- 0 Alejandro Ct Unit 9962639
- 0 Alejandro Ct Unit 9966344
- 0 Alejandro Ct Unit 9972283
- 0 Alejandro Ct Unit 9973850
- 0 Alejandro Ct Unit 9973950
- 0 Alejandro Ct Unit 9976085
- 0 Alejandro Ct Unit 9980932