
Seller's Agent in 2025
Justin Aikens
Keller Williams Chervenic Rlty
(330) 388-2637
1 in this area
420 Total Sales
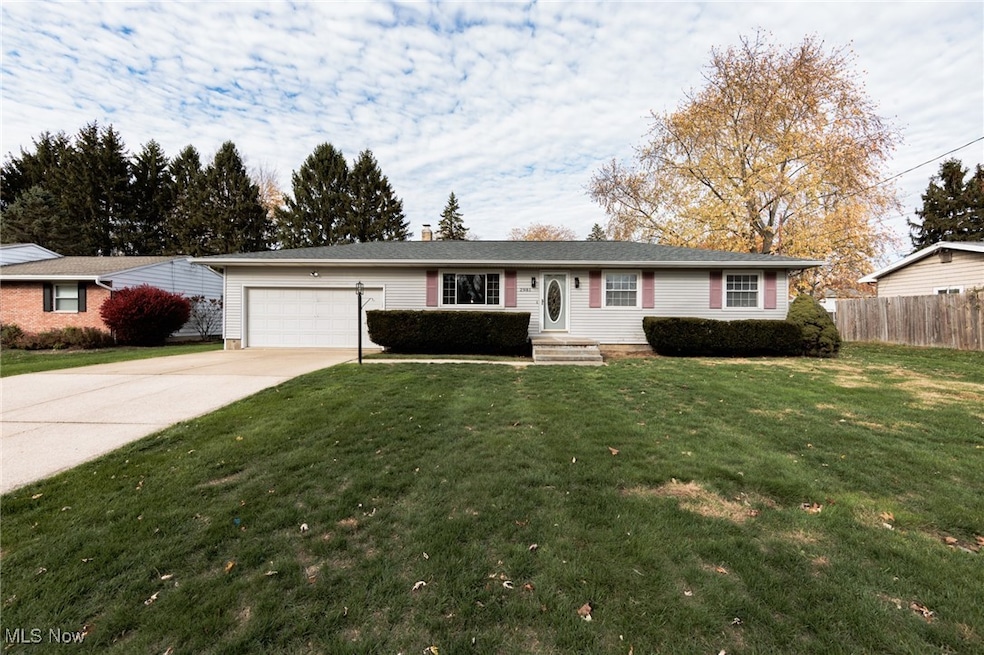


From the moment you walk in, this 3-bedroom, 1.5-bath ranch feels like a breath of fresh air. Sunlight fills the inviting living room before seamlessly flowing to the dining area. The updated kitchen shines with stainless steel appliances, stylish finishes, and a convenient breakfast bar that makes every morning a breeze. Updated bathrooms and thoughtful details throughout give the home a clean, contemporary feel while maintaining its welcoming character. You'll find a spacious, sunken second living room towards the back of the home, featuring a fireplace perfect for cozy evenings. Step outside to your private backyard — complete with a large deck for entertaining, a patio with a basketball hoop and a fully fenced yard ready for play or pets. You'll find a full basement with laundry hookup and utility sink, providing ample storage or opportunity to finish and add value. With an attached two car-garage completing the picture, this bright and beautifully updated home offers effortless living and is ready for you to simply move in and enjoy. Updates include a new roof, well pump and pressure tank.
Last Agent to Sell the Property
Keller Williams Chervenic Rlty Brokerage Email: jaikens@kw.com, 330-388-2637 License #2012000353 Listed on: 11/05/2025
| Date | Type | Sale Price | Title Company |
|---|---|---|---|
| Warranty Deed | $283,000 | American Title Solutions | |
| Warranty Deed | $175,000 | American Title Solutions | |
| Warranty Deed | $145,000 | Midland Commerce Group |
| Date | Status | Loan Amount | Loan Type |
|---|---|---|---|
| Open | $268,850 | New Conventional | |
| Previous Owner | $178,000 | New Conventional | |
| Previous Owner | $123,250 | Purchase Money Mortgage |
| Date | Event | Price | List to Sale | Price per Sq Ft |
|---|---|---|---|---|
| 12/29/2025 12/29/25 | Sold | $283,000 | +1.1% | $180 / Sq Ft |
| 11/26/2025 11/26/25 | Pending | -- | -- | -- |
| 11/25/2025 11/25/25 | Price Changed | $279,900 | -1.8% | $178 / Sq Ft |
| 11/14/2025 11/14/25 | Price Changed | $284,900 | -1.7% | $181 / Sq Ft |
| 11/07/2025 11/07/25 | For Sale | $289,900 | +2.4% | $184 / Sq Ft |
| 11/05/2025 11/05/25 | Off Market | $283,000 | -- | -- |
| Year | Tax Paid | Tax Assessment Tax Assessment Total Assessment is a certain percentage of the fair market value that is determined by local assessors to be the total taxable value of land and additions on the property. | Land | Improvement |
|---|---|---|---|---|
| 2025 | $2,973 | $67,050 | $15,453 | $51,597 |
| 2024 | $2,973 | $67,050 | $15,453 | $51,597 |
| 2023 | $2,973 | $67,050 | $15,453 | $51,597 |
| 2022 | $2,995 | $55,500 | $12,772 | $42,728 |
| 2021 | $3,009 | $55,500 | $12,772 | $42,728 |
| 2020 | $2,825 | $55,500 | $12,770 | $42,730 |
| 2019 | $2,565 | $43,880 | $8,170 | $35,710 |
| 2018 | $2,526 | $43,880 | $8,170 | $35,710 |
| 2017 | $2,630 | $43,880 | $8,170 | $35,710 |
| 2016 | $2,341 | $40,950 | $8,170 | $32,780 |
| 2015 | $2,630 | $40,950 | $8,170 | $32,780 |
| 2014 | $2,608 | $40,950 | $8,170 | $32,780 |
| 2013 | $2,549 | $40,340 | $8,170 | $32,170 |
Seller's Agent in 2025
Justin Aikens
Keller Williams Chervenic Rlty
(330) 388-2637
1 in this area
420 Total Sales
Buyer's Agent in 2025
Katelyn Ryan
Tarter Realty
(330) 221-7067
2 in this area
243 Total Sales
Source: MLS Now
MLS Number: 5169333
APN: 46-00074
Disclaimer: Certain information contained herein is derived from information provided by parties other than Homes.com. All information provided is deemed reliable, but is not guaranteed to be accurate and should be independently verified.
![]() IDX information is provided exclusively for personal, non-commercial use, and may not be used for any purpose other than to identify prospective properties consumers may be interested in purchasing. Information is deemed reliable but not guaranteed.
IDX information is provided exclusively for personal, non-commercial use, and may not be used for any purpose other than to identify prospective properties consumers may be interested in purchasing. Information is deemed reliable but not guaranteed.
Ask me questions while you tour the home.