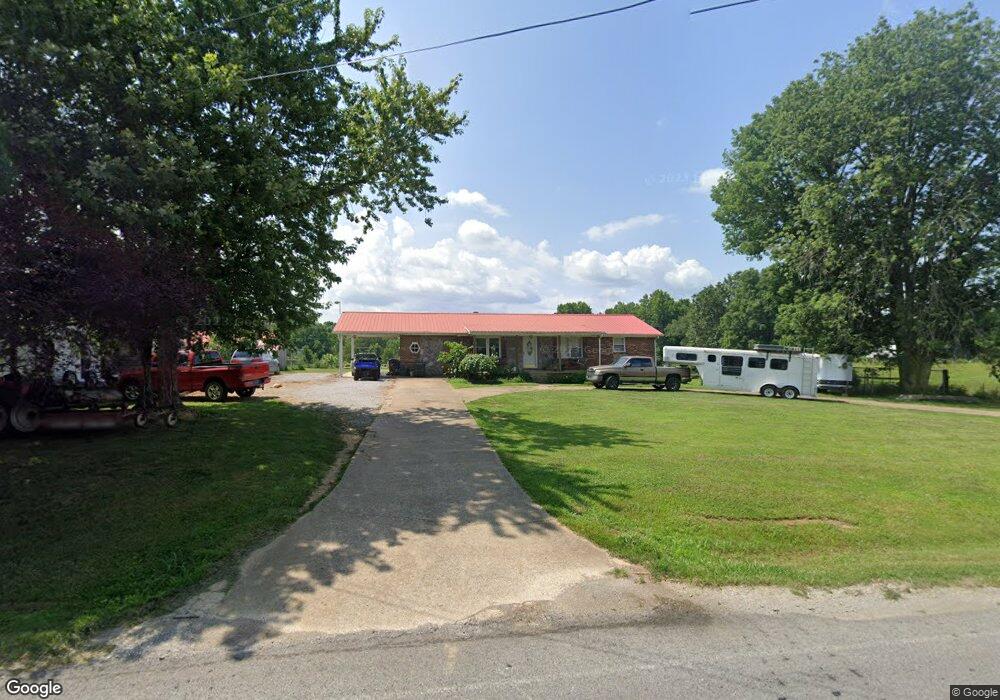
2981 Rhea Branch Rd Ethridge, TN 38456
Estimated Value: $342,000 - $596,000
--
Bed
2
Baths
2,174
Sq Ft
$212/Sq Ft
Est. Value
About This Home
This home is located at 2981 Rhea Branch Rd, Ethridge, TN 38456 and is currently estimated at $461,405, approximately $212 per square foot. 2981 Rhea Branch Rd is a home located in Giles County with nearby schools including Richland Elementary School and Richland School.
Ownership History
Date
Name
Owned For
Owner Type
Purchase Details
Closed on
May 3, 2004
Sold by
Greer James R
Bought by
Thompson James D
Current Estimated Value
Purchase Details
Closed on
Mar 7, 2001
Sold by
Greer Dorothy M
Bought by
Greer James R
Purchase Details
Closed on
Aug 6, 1993
Bought by
Greer James R and Dorothy Melissa
Purchase Details
Closed on
Nov 18, 1991
Bought by
Greer James R and Dorothy Melissa
Purchase Details
Closed on
Oct 25, 1988
Bought by
Nance Pat Ann
Purchase Details
Closed on
Oct 24, 1988
Bought by
Greer James R and Dorothy Melissa
Purchase Details
Closed on
Jan 16, 1988
Bought by
Fralix James
Purchase Details
Closed on
Jun 18, 1983
Bought by
Fralix James and Fralix Janet
Purchase Details
Closed on
Jan 1, 1980
Create a Home Valuation Report for This Property
The Home Valuation Report is an in-depth analysis detailing your home's value as well as a comparison with similar homes in the area
Home Values in the Area
Average Home Value in this Area
Purchase History
| Date | Buyer | Sale Price | Title Company |
|---|---|---|---|
| Thompson James D | $159,900 | -- | |
| Greer James R | -- | -- | |
| Greer Dorothy | -- | -- | |
| Greer James R | -- | -- | |
| Greer James R | $32,000 | -- | |
| Nance Pat Ann | $41,000 | -- | |
| Greer James R | -- | -- | |
| Fralix James | -- | -- | |
| Fralix James | -- | -- | |
| -- | $6,000 | -- |
Source: Public Records
Tax History Compared to Growth
Tax History
| Year | Tax Paid | Tax Assessment Tax Assessment Total Assessment is a certain percentage of the fair market value that is determined by local assessors to be the total taxable value of land and additions on the property. | Land | Improvement |
|---|---|---|---|---|
| 2024 | $1,160 | $58,375 | $11,225 | $47,150 |
| 2023 | $1,160 | $58,375 | $11,225 | $47,150 |
| 2022 | $1,135 | $57,150 | $11,225 | $45,925 |
| 2021 | $1,268 | $44,875 | $8,450 | $36,425 |
| 2020 | $1,268 | $44,875 | $8,450 | $36,425 |
| 2019 | $1,268 | $44,875 | $8,450 | $36,425 |
| 2018 | $1,268 | $44,875 | $8,450 | $36,425 |
| 2017 | $1,268 | $44,875 | $8,450 | $36,425 |
| 2016 | $1,292 | $43,475 | $7,450 | $36,025 |
| 2015 | $1,205 | $43,475 | $7,450 | $36,025 |
| 2014 | $1,205 | $43,480 | $0 | $0 |
Source: Public Records
Map
Nearby Homes
- 2338 Rhea Branch Rd
- 2310 Rhea Branch Rd
- 2346 Rhea Branch Rd
- 3812 Rhea Branch Rd
- 2270 Schuler Branch Rd
- 2270 Shuler Branch Rd
- 1344 Cut Off Rd
- 492 Campbellsville Pike
- 13546 Campbellsville Rd
- 13581 Campbellsville Rd
- 9718 Campbellsville Rd
- 9706 Campbellsville Rd
- 9716 Campbellsville Rd
- 9710 Campbellsville Rd
- 0 Powdermill Bridge Rd
- 14035 Campbellsville Rd
- 14256 Campbellsville Rd
- 0 Weakley Loop
- 1277 Campbellsville Pike
- 5 Carol Rd
- 3065 Rhea Branch Rd
- 2811 Rhea Branch Rd
- 3174 Rhea Branch Rd
- 2769 Rhea Branch Rd
- 2769 Rhea Branch Rd
- 2773 Rhea Branch Rd
- 2773 Rhea Branch Rd
- 3127 Rhea Branch Rd
- 3066 Rhea Branch Rd
- 458 Dickey Rd
- 391 Dickey Rd
- 3351 Rhea Branch Rd
- 3351 Rhea Branch Rd
- 00 Shuler Branch Rd
- 0 Shuler Branch Rd
- 160 Casteel Rd
- 160 Casteel Rd
- 148 Buckner Rd
- 197 Casteel Rd
- 161 Casteel Rd