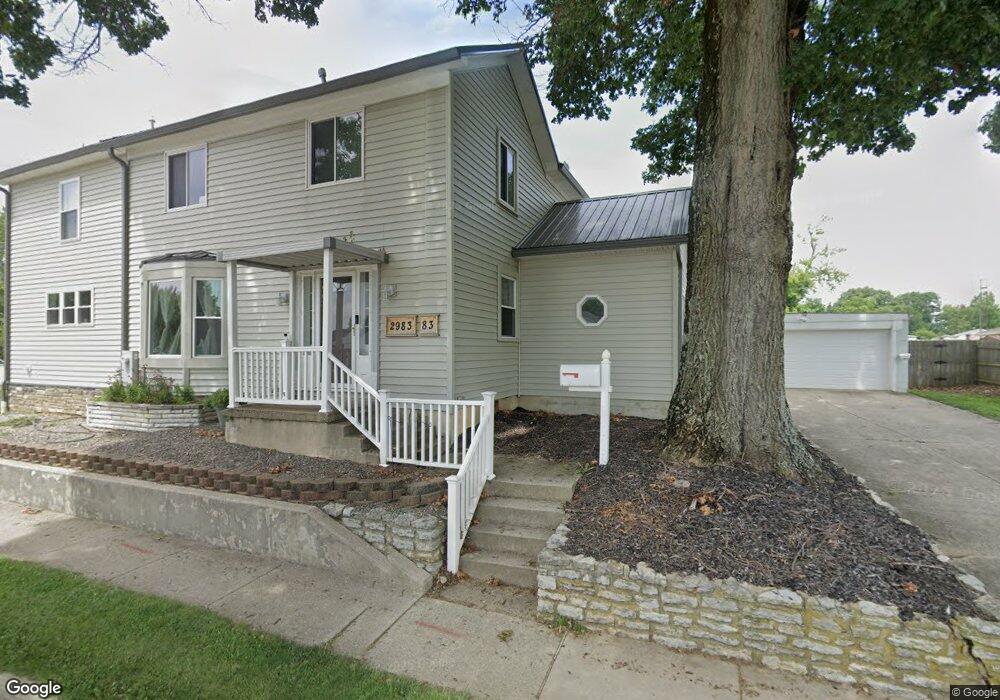
2983 E Stroop Rd Dayton, OH 45440
Estimated Value: $286,000 - $421,000
5
Beds
5
Baths
5,133
Sq Ft
$73/Sq Ft
Est. Value
About This Home
This home is located at 2983 E Stroop Rd, Dayton, OH 45440 and is currently estimated at $372,509, approximately $72 per square foot. 2983 E Stroop Rd is a home located in Montgomery County with nearby schools including Indian Riffle Elementary School, Kettering Middle School, and Kettering Fairmont High School.
Ownership History
Date
Name
Owned For
Owner Type
Purchase Details
Closed on
Jun 27, 2023
Sold by
Becker Amy C and Wyant Amy C
Bought by
Wyant Jordan A and Wyant Amy C
Current Estimated Value
Home Financials for this Owner
Home Financials are based on the most recent Mortgage that was taken out on this home.
Original Mortgage
$427,452
Outstanding Balance
$415,060
Interest Rate
6.57%
Mortgage Type
Credit Line Revolving
Estimated Equity
-$42,551
Purchase Details
Closed on
Dec 18, 2008
Sold by
Becker Robert L and Becker Maureen P
Bought by
Becker Amy C
Home Financials for this Owner
Home Financials are based on the most recent Mortgage that was taken out on this home.
Original Mortgage
$108,500
Interest Rate
6.3%
Mortgage Type
Purchase Money Mortgage
Purchase Details
Closed on
Oct 26, 2006
Sold by
Becker Robert
Bought by
Becker Robert L and Becker Maureen P
Create a Home Valuation Report for This Property
The Home Valuation Report is an in-depth analysis detailing your home's value as well as a comparison with similar homes in the area
Home Values in the Area
Average Home Value in this Area
Purchase History
| Date | Buyer | Sale Price | Title Company |
|---|---|---|---|
| Wyant Jordan A | -- | None Listed On Document | |
| Becker Amy C | $138,500 | Multiple | |
| Becker Robert L | $103,400 | Attorney |
Source: Public Records
Mortgage History
| Date | Status | Borrower | Loan Amount |
|---|---|---|---|
| Open | Wyant Jordan A | $427,452 | |
| Previous Owner | Becker Amy C | $108,500 |
Source: Public Records
Tax History
| Year | Tax Paid | Tax Assessment Tax Assessment Total Assessment is a certain percentage of the fair market value that is determined by local assessors to be the total taxable value of land and additions on the property. | Land | Improvement |
|---|---|---|---|---|
| 2025 | $4,846 | $134,700 | $20,070 | $114,630 |
| 2024 | $4,709 | $75,490 | $20,070 | $55,420 |
| 2023 | $4,709 | $75,490 | $20,070 | $55,420 |
| 2022 | $4,620 | $58,550 | $15,550 | $43,000 |
| 2021 | $4,009 | $54,870 | $15,550 | $39,320 |
| 2020 | $4,021 | $54,870 | $15,550 | $39,320 |
| 2019 | $3,850 | $46,430 | $15,550 | $30,880 |
| 2018 | $3,871 | $46,430 | $15,550 | $30,880 |
| 2017 | $3,567 | $46,430 | $15,550 | $30,880 |
| 2016 | $3,315 | $40,530 | $15,550 | $24,980 |
| 2015 | $3,168 | $40,530 | $15,550 | $24,980 |
| 2014 | $3,168 | $40,530 | $15,550 | $24,980 |
| 2012 | -- | $38,080 | $15,550 | $22,530 |
Source: Public Records
Map
Nearby Homes
- 4086 Glenheath Dr
- 3170 E Stroop Rd Unit 103
- 2716 Hemphill Rd
- 2776 Corlington Dr
- 4485 Sentry Hill Ct
- 2816 Corlington Dr
- 2364 Hemphill Rd
- 430 Craftsbury Ct
- 4408 Glenheath Dr
- 4426 Woodbank Dr
- 3041 Revlon Dr
- 2197 Bending Willow Dr
- 3313 Braddock St
- 4524 Drayton Ct
- 4416 Timberwilde Dr
- 4351 Sillman Place
- 3167 Gracemore Ave
- 861 Acorn Dr
- 2648 Parklawn Dr
- 4190 Woodman Dr
- 3001 E Stroop Rd
- 2943 E Stroop Rd
- 3933 Leonora Dr
- 4001 Wagner Rd
- 3925 Leonora Dr
- 2930 E Stroop Rd
- 4008 Wagner Rd
- 3012 E Stroop Rd
- 2900 E Stroop Rd
- 3917 Leonora Dr
- 4009 Wagner Rd
- 3932 Leonora Dr
- 2890 E Stroop Rd
- 4016 Wagner Rd
- 3024 E Stroop Rd
- 3909 Leonora Dr
- 4017 Wagner Rd
- 3924 Leonora Dr
- 3037 E Stroop Rd
- 2860 E Stroop Rd
Your Personal Tour Guide
Ask me questions while you tour the home.