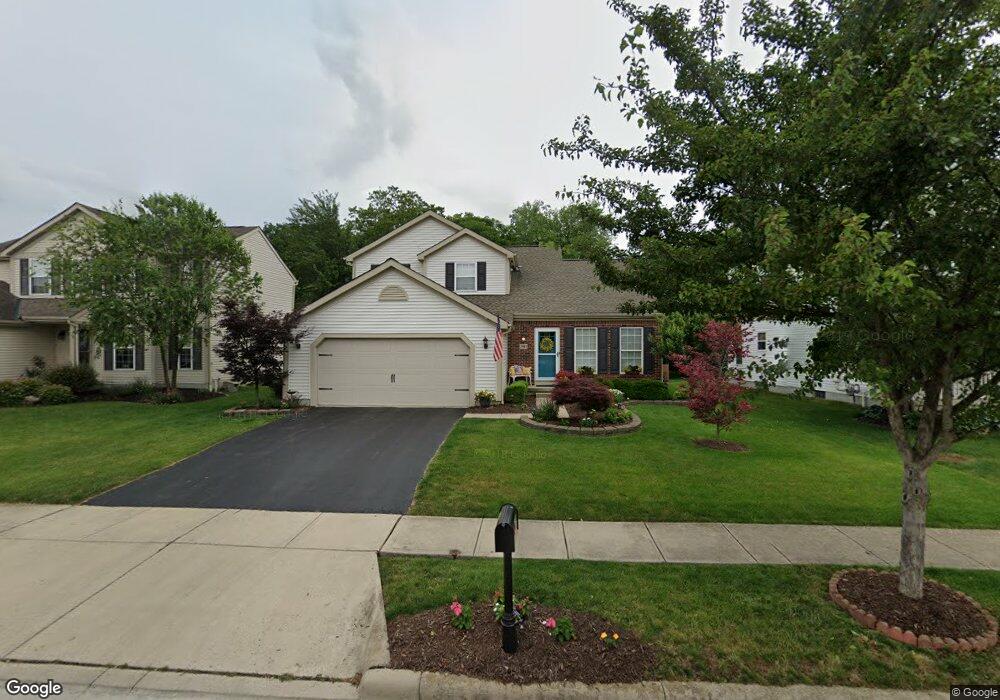
2983 Splitrock Rd Columbus, OH 43221
Highpoint-Glen NeighborhoodEstimated Value: $408,872 - $494,000
3
Beds
3
Baths
1,782
Sq Ft
$263/Sq Ft
Est. Value
About This Home
This home is located at 2983 Splitrock Rd, Columbus, OH 43221 and is currently estimated at $469,218, approximately $263 per square foot. 2983 Splitrock Rd is a home located in Franklin County with nearby schools including Ridgewood Elementary School, Hilliard Tharp Sixth Grade Elementary School, and Hilliard Weaver Middle School.
Ownership History
Date
Name
Owned For
Owner Type
Purchase Details
Closed on
May 23, 2017
Sold by
Roederer Lorilee
Bought by
Roederer Lorilee and Calendine Jill M
Current Estimated Value
Home Financials for this Owner
Home Financials are based on the most recent Mortgage that was taken out on this home.
Original Mortgage
$234,889
Outstanding Balance
$194,284
Interest Rate
4.25%
Mortgage Type
FHA
Estimated Equity
$274,934
Purchase Details
Closed on
Aug 16, 2005
Sold by
Sickles Vicki D and Sickles Chris
Bought by
Roederer Lorilee
Home Financials for this Owner
Home Financials are based on the most recent Mortgage that was taken out on this home.
Original Mortgage
$179,920
Interest Rate
5.37%
Mortgage Type
Fannie Mae Freddie Mac
Purchase Details
Closed on
Mar 21, 2002
Sold by
M/I Schottenstein Homes Inc
Bought by
Sickles Vicki D
Home Financials for this Owner
Home Financials are based on the most recent Mortgage that was taken out on this home.
Original Mortgage
$211,933
Interest Rate
6.87%
Mortgage Type
FHA
Create a Home Valuation Report for This Property
The Home Valuation Report is an in-depth analysis detailing your home's value as well as a comparison with similar homes in the area
Home Values in the Area
Average Home Value in this Area
Purchase History
| Date | Buyer | Sale Price | Title Company |
|---|---|---|---|
| Roederer Lorilee | -- | None Available | |
| Roederer Lorilee | $224,900 | -- | |
| Sickles Vicki D | $217,200 | Transohio Residential Title |
Source: Public Records
Mortgage History
| Date | Status | Borrower | Loan Amount |
|---|---|---|---|
| Open | Roederer Lorilee | $234,889 | |
| Previous Owner | Roederer Lorilee | $179,920 | |
| Previous Owner | Sickles Vicki D | $211,933 |
Source: Public Records
Tax History
| Year | Tax Paid | Tax Assessment Tax Assessment Total Assessment is a certain percentage of the fair market value that is determined by local assessors to be the total taxable value of land and additions on the property. | Land | Improvement |
|---|---|---|---|---|
| 2025 | $7,008 | $124,080 | $35,700 | $88,380 |
| 2024 | $7,008 | $124,080 | $35,700 | $88,380 |
| 2023 | $6,071 | $124,075 | $35,700 | $88,375 |
| 2022 | $5,580 | $91,320 | $19,110 | $72,210 |
| 2021 | $5,574 | $91,320 | $19,110 | $72,210 |
| 2020 | $5,461 | $89,710 | $19,110 | $70,600 |
| 2019 | $5,302 | $74,380 | $15,930 | $58,450 |
| 2018 | $5,169 | $74,380 | $15,930 | $58,450 |
| 2017 | $5,338 | $74,380 | $15,930 | $58,450 |
| 2016 | $5,395 | $70,390 | $15,370 | $55,020 |
| 2015 | $5,057 | $70,390 | $15,370 | $55,020 |
| 2014 | $5,066 | $70,390 | $15,370 | $55,020 |
| 2013 | $2,566 | $70,385 | $15,365 | $55,020 |
Source: Public Records
Map
Nearby Homes
- 3423 Ledge Ln
- 3120 Capstone Way
- 3246 Summerdale Ln Unit 34
- 3558 Kinsale Head Dr Unit 560
- 3231 Stonecrest Ct Unit 40
- 3167 Griggsview Ct
- 3705 Hilliard Station Rd Unit 3705
- 3660 Hilliard Station Rd Unit 3660
- 3757 Mill Stream Dr Unit 12
- 3479 Fishinger Mill Dr
- 3827 Mill Stream Dr Unit 20
- 3422 Smiley's Corner
- 3782 Falls Circle Dr Unit 25
- 3828 Falls Circle Dr Unit 22
- 3820 Falls Circle Dr
- 3000 Scioto Place
- 2861 Chateau Cir Unit 22
- 2824 Chateau Cir S Unit 86
- 3414 Loire Ln
- 2837 Canterbury Ln
- 2991 Splitrock Rd
- 2975 Splitrock Rd
- 2967 Splitrock Rd
- 2999 Splitrock Rd
- 3441 Jillmarie Ct
- 3428 Missy Ln
- 2992 Splitrock Rd
- 3416 Ridge Gap Rd
- 2959 Splitrock Rd
- 3007 Splitrock Rd
- 2972 Splitrock Rd
- 3438 Jillmarie Ct
- 3449 Jillmarie Ct
- 2964 Splitrock Rd
- 3408 Ridge Gap Rd
- 2951 Splitrock Rd
- 3015 Splitrock Rd
- 3444 Missy Ln
- 3427 Column Dr
- 2956 Splitrock Rd
Your Personal Tour Guide
Ask me questions while you tour the home.