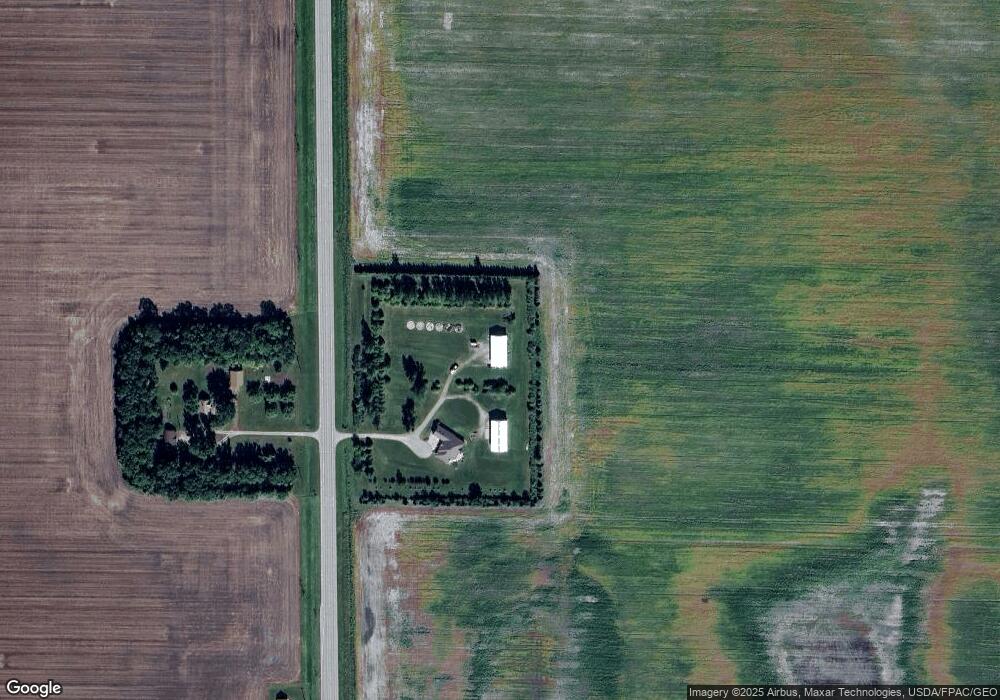
2984 Highway 9 N Glyndon, MN 56547
Estimated Value: $527,000 - $676,475
4
Beds
3
Baths
3,600
Sq Ft
$170/Sq Ft
Est. Value
About This Home
This home is located at 2984 Highway 9 N, Glyndon, MN 56547 and is currently estimated at $610,825, approximately $169 per square foot. 2984 Highway 9 N is a home located in Clay County with nearby schools including Dilworth-Glyndon-Felton Middle School and Dilworth-Glyndon-Felton Senior High School.
Ownership History
Date
Name
Owned For
Owner Type
Purchase Details
Closed on
Dec 18, 2013
Sold by
Cummings Jeffrey D and Cummings Leann S
Bought by
Haug Forrest L and Haug Kimberly J
Current Estimated Value
Home Financials for this Owner
Home Financials are based on the most recent Mortgage that was taken out on this home.
Original Mortgage
$330,000
Outstanding Balance
$248,297
Interest Rate
4.38%
Mortgage Type
New Conventional
Estimated Equity
$362,528
Create a Home Valuation Report for This Property
The Home Valuation Report is an in-depth analysis detailing your home's value as well as a comparison with similar homes in the area
Home Values in the Area
Average Home Value in this Area
Purchase History
| Date | Buyer | Sale Price | Title Company |
|---|---|---|---|
| Haug Forrest L | $505,000 | Trn Abstract & Title |
Source: Public Records
Mortgage History
| Date | Status | Borrower | Loan Amount |
|---|---|---|---|
| Open | Haug Forrest L | $330,000 |
Source: Public Records
Tax History Compared to Growth
Tax History
| Year | Tax Paid | Tax Assessment Tax Assessment Total Assessment is a certain percentage of the fair market value that is determined by local assessors to be the total taxable value of land and additions on the property. | Land | Improvement |
|---|---|---|---|---|
| 2025 | $6,038 | $705,600 | $57,400 | $648,200 |
| 2024 | $6,038 | $661,700 | $57,400 | $604,300 |
| 2023 | $5,612 | $636,500 | $60,100 | $576,400 |
| 2022 | $5,236 | $579,400 | $60,100 | $519,300 |
| 2021 | $4,422 | $488,900 | $60,100 | $428,800 |
| 2020 | $4,318 | $418,300 | $60,100 | $358,200 |
| 2019 | $3,874 | $418,300 | $60,100 | $358,200 |
| 2018 | $3,812 | $422,500 | $60,100 | $362,400 |
| 2017 | $3,542 | $423,200 | $60,100 | $363,100 |
| 2016 | $3,268 | $362,600 | $40,800 | $321,800 |
| 2015 | $2,970 | $325,200 | $40,800 | $284,400 |
| 2014 | $3,266 | $325,200 | $40,800 | $284,400 |
Source: Public Records
Map
Nearby Homes