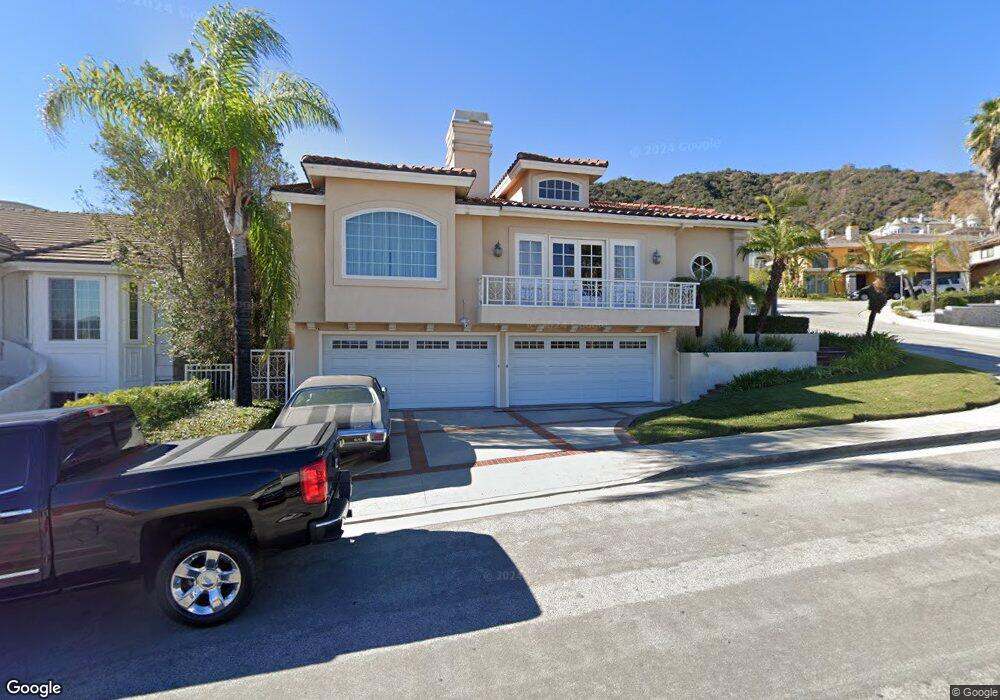
2986 Oakmont View Dr Glendale, CA 91208
Oakmont NeighborhoodEstimated Value: $2,251,690 - $2,785,000
4
Beds
5
Baths
3,450
Sq Ft
$698/Sq Ft
Est. Value
About This Home
This home is located at 2986 Oakmont View Dr, Glendale, CA 91208 and is currently estimated at $2,408,923, approximately $698 per square foot. 2986 Oakmont View Dr is a home located in Los Angeles County with nearby schools including John C. Fremont Elementary School, Rosemont Middle School, and Crescenta Valley High School.
Ownership History
Date
Name
Owned For
Owner Type
Purchase Details
Closed on
Jun 2, 2020
Sold by
Seaver Roger E and Seaver Rizalina G
Bought by
Yegoyan Shushan
Current Estimated Value
Home Financials for this Owner
Home Financials are based on the most recent Mortgage that was taken out on this home.
Original Mortgage
$765,000
Outstanding Balance
$678,114
Interest Rate
3.2%
Mortgage Type
New Conventional
Estimated Equity
$1,730,809
Purchase Details
Closed on
Sep 1, 2004
Sold by
Seaver Roger E and Seaver Rizalina G
Bought by
Seaver Roger E and Seaver Rizalina G
Create a Home Valuation Report for This Property
The Home Valuation Report is an in-depth analysis detailing your home's value as well as a comparison with similar homes in the area
Home Values in the Area
Average Home Value in this Area
Purchase History
| Date | Buyer | Sale Price | Title Company |
|---|---|---|---|
| Yegoyan Shushan | $1,700,000 | Provident Title Company | |
| Seaver Roger E | -- | -- |
Source: Public Records
Mortgage History
| Date | Status | Borrower | Loan Amount |
|---|---|---|---|
| Open | Yegoyan Shushan | $765,000 |
Source: Public Records
Tax History Compared to Growth
Tax History
| Year | Tax Paid | Tax Assessment Tax Assessment Total Assessment is a certain percentage of the fair market value that is determined by local assessors to be the total taxable value of land and additions on the property. | Land | Improvement |
|---|---|---|---|---|
| 2025 | $20,154 | $1,859,194 | $1,103,268 | $755,926 |
| 2024 | $20,154 | $1,822,740 | $1,081,636 | $741,104 |
| 2023 | $19,693 | $1,787,001 | $1,060,428 | $726,573 |
| 2022 | $19,352 | $1,751,963 | $1,039,636 | $712,327 |
| 2021 | $19,021 | $1,717,611 | $1,019,251 | $698,360 |
| 2020 | $11,493 | $1,030,391 | $419,445 | $610,946 |
| 2019 | $11,214 | $1,010,188 | $411,221 | $598,967 |
| 2018 | $11,006 | $990,381 | $403,158 | $587,223 |
| 2016 | $10,416 | $951,924 | $387,503 | $564,421 |
| 2015 | $10,203 | $937,626 | $381,683 | $555,943 |
| 2014 | $10,109 | $919,260 | $374,207 | $545,053 |
Source: Public Records
Map
Nearby Homes
- 3323 Barnes Cir
- 3422 Esperanza Terrace
- 3417 Oakmont View Dr
- 3300 Beaudry Terrace
- 3351 Country Club Dr
- 1300 Daily Cir
- 3408 Las Palmas Ave
- 3508 Rosemary Ave
- 3328 N Verdugo Rd
- 3120 N Verdugo Rd
- 3521 Ocean View Blvd
- 2606 Hermosa Ave
- 2741 Hermosa Ave Unit B
- 0 Bayberry Dr Unit 25567317
- 4004 Orangedale Ave
- 2468 Montrose Ave Unit 6
- 3226 Menlo Dr
- 3928 La Crescenta Ave
- 2707 Hermosita Dr
- 2940 N Verdugo Rd Unit 411
- 3337 Barnes Cir
- 3352 Deer Creek Ln
- 3346 Deer Creek Ln
- 3400 Ayars Canyon Way
- 3329 Barnes Cir
- 3300 Oakmont View Dr
- 3340 Deer Creek Ln
- 3301 Oakmont View Dr
- 3338 Barnes Cir
- 3401 Ayars Canyon Way
- 3334 Barnes Cir
- 3412 Ayars Canyon Way
- 3310 Oakmont View Dr
- 3334 Deer Creek Ln
- 3405 Ayars Canyon Way
- 3351 Deer Creek Ln
- 3311 Oakmont View Dr
- 3328 Barnes Cir
- 3341 Deer Creek Ln
- 3317 Barnes Cir