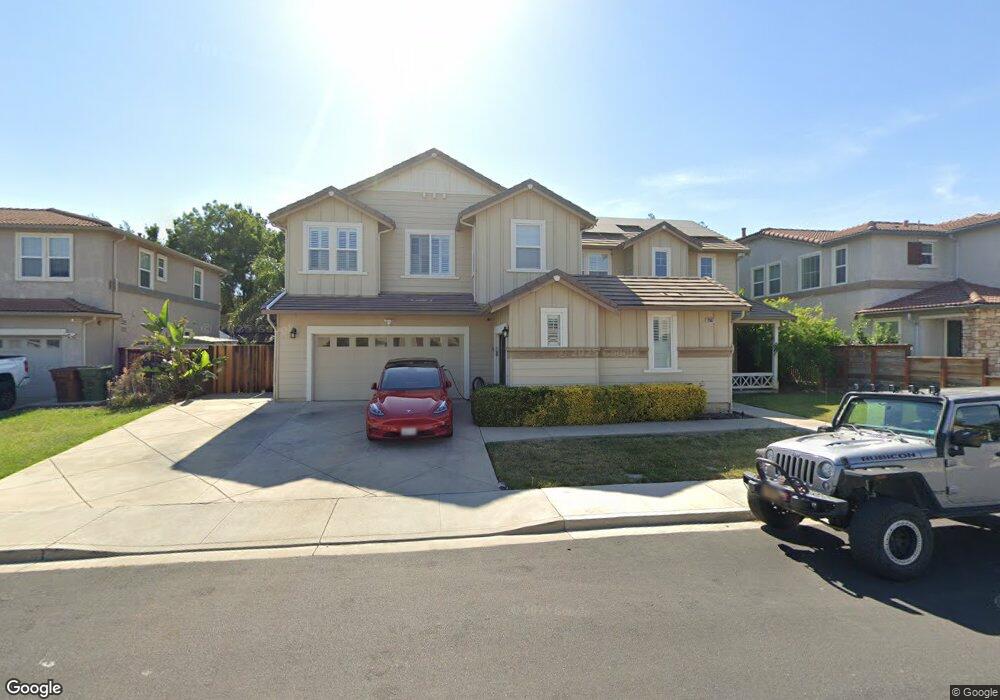
2987 Blumen Ave Brentwood, CA 94513
Prewett Ranch NeighborhoodEstimated Value: $1,002,607 - $1,260,000
5
Beds
4
Baths
3,831
Sq Ft
$281/Sq Ft
Est. Value
About This Home
This home is located at 2987 Blumen Ave, Brentwood, CA 94513 and is currently estimated at $1,077,152, approximately $281 per square foot. 2987 Blumen Ave is a home located in Contra Costa County with nearby schools including Marsh Creek Elementary School, William B. Bristow Middle School, and Liberty High School.
Ownership History
Date
Name
Owned For
Owner Type
Purchase Details
Closed on
Mar 28, 2021
Sold by
Nguyen Diane Dung and Diane Dung Nguyen Revocable Li
Bought by
Tang Tri Quoc
Current Estimated Value
Purchase Details
Closed on
Jun 1, 2015
Sold by
Nguyen Diane Dung
Bought by
Nguyen Diane Dung
Purchase Details
Closed on
May 31, 2012
Sold by
Secretary Of Housing & Urban Development
Bought by
Nguyen Diane Dung
Purchase Details
Closed on
Sep 24, 2010
Sold by
Bac Home Loans Servicing Lp
Bought by
The Secretary Of Housing & Urban Develop
Purchase Details
Closed on
Jun 19, 2008
Sold by
Richmond American Homes Of Maryland Inc
Bought by
Lacy Dennis L and Lacy Melody
Home Financials for this Owner
Home Financials are based on the most recent Mortgage that was taken out on this home.
Original Mortgage
$468,383
Interest Rate
6.04%
Mortgage Type
FHA
Create a Home Valuation Report for This Property
The Home Valuation Report is an in-depth analysis detailing your home's value as well as a comparison with similar homes in the area
Home Values in the Area
Average Home Value in this Area
Purchase History
| Date | Buyer | Sale Price | Title Company |
|---|---|---|---|
| Tang Tri Quoc | -- | None Available | |
| Nguyen Diane Dung | -- | None Available | |
| Nguyen Diane Dung | $360,000 | Chicago Title Company | |
| The Secretary Of Housing & Urban Develop | -- | Landsafe Title | |
| Bac Home Loans Servicing Lp | $487,506 | Landsafe Title | |
| Lacy Dennis L | $475,000 | Chicago Title Company |
Source: Public Records
Mortgage History
| Date | Status | Borrower | Loan Amount |
|---|---|---|---|
| Previous Owner | Lacy Dennis L | $468,383 |
Source: Public Records
Tax History Compared to Growth
Tax History
| Year | Tax Paid | Tax Assessment Tax Assessment Total Assessment is a certain percentage of the fair market value that is determined by local assessors to be the total taxable value of land and additions on the property. | Land | Improvement |
|---|---|---|---|---|
| 2025 | $13,743 | $955,086 | $212,241 | $742,845 |
| 2024 | $13,611 | $936,360 | $208,080 | $728,280 |
| 2023 | $13,611 | $918,000 | $204,000 | $714,000 |
| 2022 | $13,343 | $900,000 | $200,000 | $700,000 |
| 2021 | $7,923 | $417,737 | $52,215 | $365,522 |
| 2019 | $8,120 | $405,349 | $50,667 | $354,682 |
| 2018 | $7,999 | $397,402 | $49,674 | $347,728 |
| 2017 | $7,698 | $389,610 | $48,700 | $340,910 |
| 2016 | $7,312 | $381,972 | $47,746 | $334,226 |
| 2015 | $7,338 | $376,235 | $47,029 | $329,206 |
| 2014 | $7,350 | $368,866 | $46,108 | $322,758 |
Source: Public Records
Map
Nearby Homes
- 2986 Atherton Place
- 1148 Breton Dr
- 2828 Pristine Way
- 504 Silver Spur Ln
- 1101 Beau Ave
- 2856 Gardenside Ct
- 21 Foxglove Ct
- 1097 Teal Ct
- 43 Sorrel Ct
- 1124 Europena Dr
- 227 Hibiscus Way
- 1357 Tiffany Dr
- 1267 Picadilly Ln
- 2571 Anderson Ln
- 1004 Royal Tern Ct
- 1839 Elizabeth Way
- 45 Nettle Ct
- 50 Safflower Ct
- 2029 Fitzgerald Way
- 297 Eagle Nest Dr
- 2985 Blumen Ave
- 2989 Blumen Ave
- 1224 Sheldon Dr
- 1226 Sheldon Dr
- 2986 Blumen Ave
- 2983 Blumen Ave
- 2984 Blumen Ave
- 2988 Blumen Ave
- 1222 Sheldon Dr
- 1228 Sheldon Dr
- 2982 Blumen Ave
- 2990 Blumen Ave
- 2981 Blumen Ave
- 1200 Holsapple Way
- 1230 Sheldon Dr
- 2980 Blumen Ave
- 1223 Sheldon Dr
- 1198 Holsapple Way
- 1225 Sheldon Dr
- 1227 Sheldon Dr