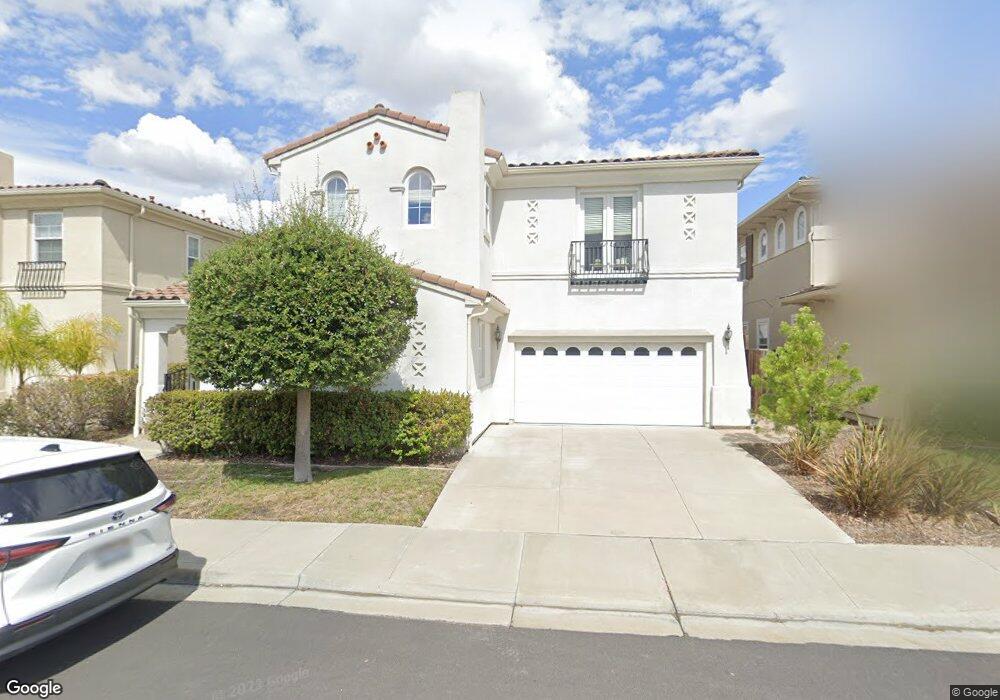
2987 Innisbrook Way Dublin, CA 94568
Dublin Ranch NeighborhoodEstimated Value: $2,147,000 - $2,765,000
5
Beds
5
Baths
3,854
Sq Ft
$637/Sq Ft
Est. Value
About This Home
This home is located at 2987 Innisbrook Way, Dublin, CA 94568 and is currently estimated at $2,456,477, approximately $637 per square foot. 2987 Innisbrook Way is a home located in Alameda County with nearby schools including J.M. Amador Elementary School, Dublin High School, and The Quarry Lane School.
Ownership History
Date
Name
Owned For
Owner Type
Purchase Details
Closed on
Jul 30, 2017
Sold by
Chen Gracie
Bought by
Chen Gracie Guoxin and The Gracie Guoxin Chen Living
Current Estimated Value
Purchase Details
Closed on
Jun 20, 2012
Sold by
Tran Kiem D and Le Huong T
Bought by
Chen Weixiong and Chen Gracie
Home Financials for this Owner
Home Financials are based on the most recent Mortgage that was taken out on this home.
Original Mortgage
$607,500
Outstanding Balance
$419,237
Interest Rate
3.74%
Mortgage Type
New Conventional
Estimated Equity
$2,037,240
Purchase Details
Closed on
Aug 1, 2005
Sold by
Toll Ca Ii Lp
Bought by
Tran Keim D and Le Huong T
Home Financials for this Owner
Home Financials are based on the most recent Mortgage that was taken out on this home.
Original Mortgage
$850,000
Interest Rate
5.75%
Mortgage Type
New Conventional
Create a Home Valuation Report for This Property
The Home Valuation Report is an in-depth analysis detailing your home's value as well as a comparison with similar homes in the area
Home Values in the Area
Average Home Value in this Area
Purchase History
| Date | Buyer | Sale Price | Title Company |
|---|---|---|---|
| Chen Gracie Guoxin | -- | None Available | |
| Chen Weixiong | $810,000 | Old Republic Title Company | |
| Tran Keim D | $1,162,000 | Chicago Title Co |
Source: Public Records
Mortgage History
| Date | Status | Borrower | Loan Amount |
|---|---|---|---|
| Open | Chen Weixiong | $607,500 | |
| Previous Owner | Tran Keim D | $850,000 |
Source: Public Records
Tax History Compared to Growth
Tax History
| Year | Tax Paid | Tax Assessment Tax Assessment Total Assessment is a certain percentage of the fair market value that is determined by local assessors to be the total taxable value of land and additions on the property. | Land | Improvement |
|---|---|---|---|---|
| 2025 | $13,584 | $1,010,351 | $305,205 | $712,146 |
| 2024 | $13,584 | $990,408 | $299,222 | $698,186 |
| 2023 | $13,437 | $977,855 | $293,356 | $684,499 |
| 2022 | $13,272 | $951,683 | $287,605 | $671,078 |
| 2021 | $13,153 | $932,891 | $281,967 | $657,924 |
| 2020 | $12,313 | $930,260 | $279,078 | $651,182 |
| 2019 | $12,304 | $912,027 | $273,608 | $638,419 |
| 2018 | $12,012 | $894,150 | $268,245 | $625,905 |
| 2017 | $11,851 | $876,621 | $262,986 | $613,635 |
| 2016 | $10,810 | $859,434 | $257,830 | $601,604 |
| 2015 | $10,427 | $846,530 | $253,959 | $592,571 |
| 2014 | $10,440 | $829,950 | $248,985 | $580,965 |
Source: Public Records
Map
Nearby Homes
- 2848 E Cog Hill Terrace
- 4986 Grayhawk Ct
- 6010 Turnberry Dr
- 6013 Kingsmill Terrace
- 2528 Amantea Way
- 5636 N Dublin Ranch Dr
- 3005 Vittoria Loop
- 3105 Vittoria Loop
- 3135 Vittoria Loop
- 2371 Capistrello St
- 3956 Jordan Ranch Dr
- 3970 Jordan Ranch Dr
- 3493 Capoterra Way
- 3898 Highpointe Ct
- 4456 Sunset View Dr
- 2378 Carbondale Way
- 4369 Table Mountain Rd
- 4439 Sunset View Dr
- 3391 Monaghan St
- 2336 Carbondale Way
- 2999 Innisbrook Way
- 2973 Innisbrook Way
- 2976 W Castle Pines Terrace
- 2968 W Castle Pines Terrace
- 2951 Innisbrook Way
- 3003 Innisbrook Way
- 2956 W Castle Pines Terrace
- 2982 W Castle Pines Terrace
- 2992 Innisbrook Way
- 2980 Innisbrook Way
- 2937 Innisbrook Way
- 2938 W Castle Pines Terrace
- 3000 Innisbrook Way
- 2966 Innisbrook Way
- 5536 Eaglebrook Terrace
- 2950 Innisbrook Way
- 2926 W Castle Pines Terrace
- 2925 Innisbrook Way
- 5632 W Cog Hill Terrace
- 5522 Eaglebrook Terrace