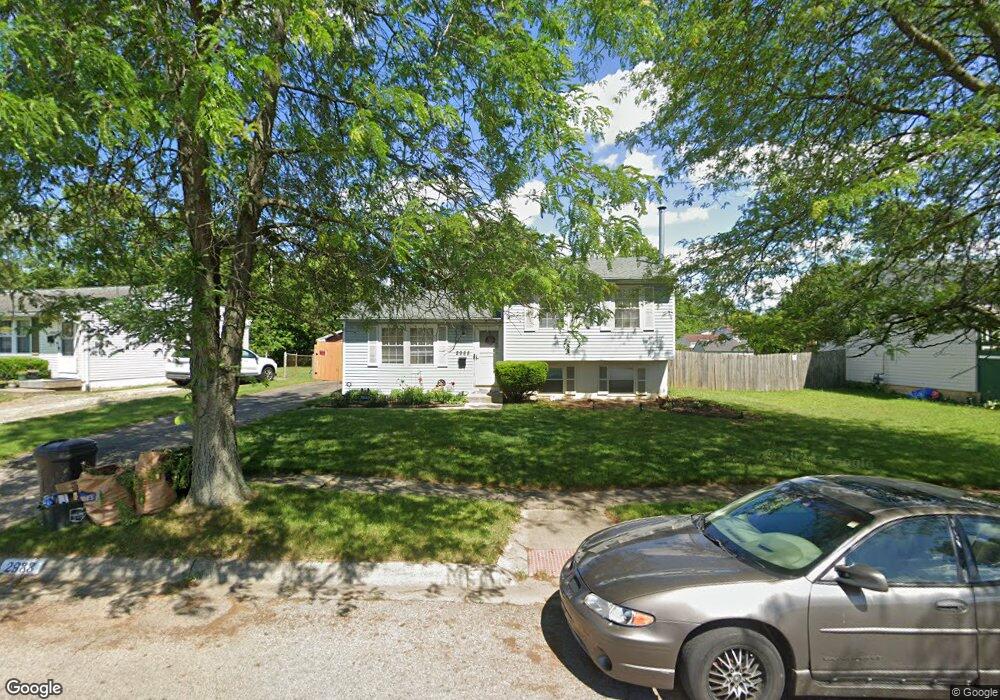
2988 Whitlow Rd Columbus, OH 43232
Walnut Heights NeighborhoodEstimated Value: $202,000 - $236,000
3
Beds
2
Baths
1,370
Sq Ft
$159/Sq Ft
Est. Value
About This Home
This home is located at 2988 Whitlow Rd, Columbus, OH 43232 and is currently estimated at $217,427, approximately $158 per square foot. 2988 Whitlow Rd is a home located in Franklin County with nearby schools including Groveport Madison High School, A+ Arts Academy, and Eastland Preparatory Academy.
Ownership History
Date
Name
Owned For
Owner Type
Purchase Details
Closed on
Jan 21, 2020
Sold by
Hayes Mccoy
Bought by
Carson Hayes Julian
Current Estimated Value
Purchase Details
Closed on
Jan 30, 2006
Sold by
Carson Julia A and Carson Hayes Julia A
Bought by
Hayes Mccoy and Carson Hayes Julia A
Purchase Details
Closed on
Apr 11, 2002
Sold by
Nanthavongdouangsy Phouvanh and Nanthavongdouangsy Samthong
Bought by
Carson Julia A
Home Financials for this Owner
Home Financials are based on the most recent Mortgage that was taken out on this home.
Original Mortgage
$87,188
Interest Rate
7.13%
Mortgage Type
FHA
Purchase Details
Closed on
Jan 26, 1994
Bought by
Nanthavongdouangsy
Purchase Details
Closed on
Jun 15, 1993
Purchase Details
Closed on
Jan 14, 1988
Create a Home Valuation Report for This Property
The Home Valuation Report is an in-depth analysis detailing your home's value as well as a comparison with similar homes in the area
Home Values in the Area
Average Home Value in this Area
Purchase History
| Date | Buyer | Sale Price | Title Company |
|---|---|---|---|
| Carson Hayes Julian | $250 | None Available | |
| Hayes Mccoy | -- | None Available | |
| Carson Julia A | $87,900 | -- | |
| Nanthavongdouangsy | $70,500 | -- | |
| -- | $68,900 | -- | |
| -- | $45,000 | -- |
Source: Public Records
Mortgage History
| Date | Status | Borrower | Loan Amount |
|---|---|---|---|
| Previous Owner | Carson Julia A | $87,188 |
Source: Public Records
Tax History Compared to Growth
Tax History
| Year | Tax Paid | Tax Assessment Tax Assessment Total Assessment is a certain percentage of the fair market value that is determined by local assessors to be the total taxable value of land and additions on the property. | Land | Improvement |
|---|---|---|---|---|
| 2024 | $2,450 | $58,210 | $18,240 | $39,970 |
| 2023 | $2,378 | $58,210 | $18,240 | $39,970 |
| 2022 | $2,033 | $32,870 | $6,830 | $26,040 |
| 2021 | $2,042 | $32,870 | $6,830 | $26,040 |
| 2020 | $2,069 | $32,870 | $6,830 | $26,040 |
| 2019 | $1,890 | $27,800 | $5,710 | $22,090 |
| 2018 | $1,916 | $27,800 | $5,710 | $22,090 |
| 2017 | $1,942 | $27,800 | $5,710 | $22,090 |
| 2016 | $1,978 | $26,150 | $4,690 | $21,460 |
| 2015 | $1,930 | $26,150 | $4,690 | $21,460 |
| 2014 | $1,948 | $26,150 | $4,690 | $21,460 |
| 2013 | $927 | $29,050 | $5,215 | $23,835 |
Source: Public Records
Map
Nearby Homes
- 3000 Whitlow Rd
- 5373 Spire Ln
- 2998 Osgood Rd E
- 5401 Spire Ln
- 5125 Upton Rd N
- 5377 Bleaker Ave
- 5137 Holbrook Dr
- 5278 Glenbriar Ct
- 2901 Renfro Rd
- 3148 Aldgate St
- 3387 Retriever Rd
- 2651 Brownfield Rd
- 3198 Gallant Dr
- 5397 Jack Russell Way
- 3289 Kady Ln
- 4906 Refugee Rd
- 2900 Ronda Rd
- 3246 Latonia Rd
- 2730 Raphael Dr
- 2991 Blue Moon Dr
- 2994 Whitlow Rd
- 2980 Whitlow Rd
- 2971 Reynard Rd Unit RIAT
- 2971 Reynard Rd
- 2979 Reynard Rd Unit RIAT
- 2979 Reynard Rd
- 2963 Reynard Rd
- 2981 Whitlow Rd
- 2987 Reynard Rd Unit RIAT
- 2987 Reynard Rd
- 3008 Whitlow Rd
- 2995 Reynard Rd Unit RIAT
- 2995 Reynard Rd
- 5289 Quincy Dr
- 2957 Reynard Rd
- 5290 Quincy Dr
- 3005 Whitlow Rd
- 3016 Whitlow Rd
- 3003 Reynard Rd Unit RIAT
- 3003 Reynard Rd