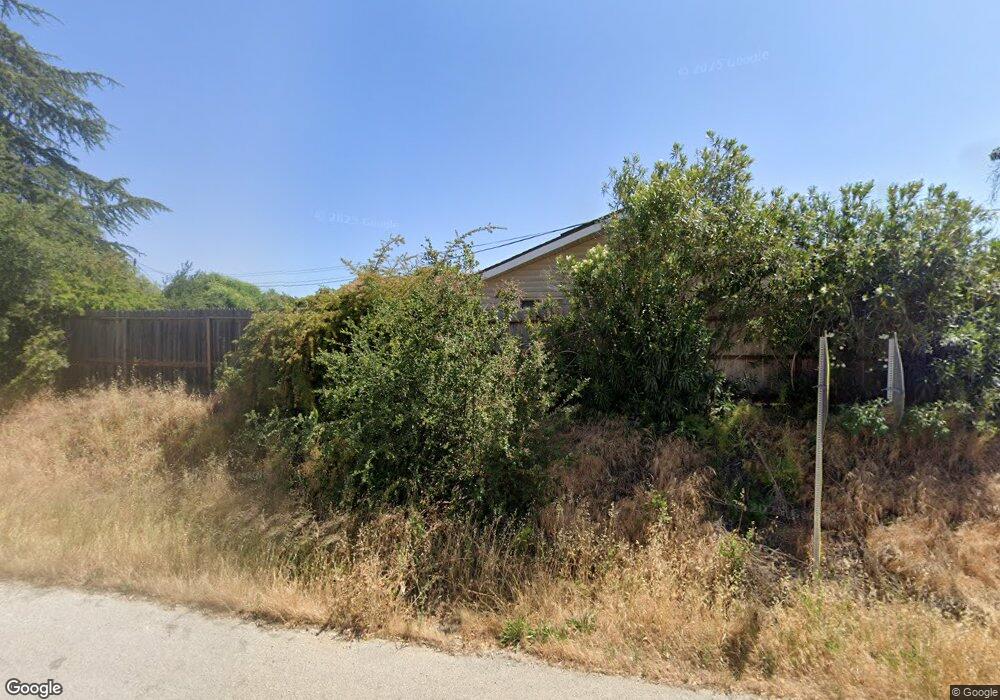
2989 Alta St Los Olivos, CA 93441
Estimated Value: $967,000 - $1,389,000
2
Beds
2
Baths
868
Sq Ft
$1,308/Sq Ft
Est. Value
About This Home
This home is located at 2989 Alta St, Los Olivos, CA 93441 and is currently estimated at $1,135,218, approximately $1,307 per square foot. 2989 Alta St is a home with nearby schools including Los Olivos Elementary School, Santa Ynez Valley Union High School, and Santa Ynez Valley Charter School.
Ownership History
Date
Name
Owned For
Owner Type
Purchase Details
Closed on
Aug 31, 2015
Sold by
Adams Doris Ann
Bought by
Adams Doris Ann and The Adams Family Trust
Current Estimated Value
Home Financials for this Owner
Home Financials are based on the most recent Mortgage that was taken out on this home.
Original Mortgage
$60,000
Interest Rate
3.85%
Mortgage Type
New Conventional
Purchase Details
Closed on
Feb 18, 2009
Sold by
Adams Harold D and Adams Doris A
Bought by
Adams Harold Dean and Adams Doris Ann
Home Financials for this Owner
Home Financials are based on the most recent Mortgage that was taken out on this home.
Original Mortgage
$40,000
Interest Rate
4.91%
Mortgage Type
New Conventional
Purchase Details
Closed on
Oct 17, 2006
Sold by
Adams Harold D and Adams Doris A
Bought by
Adams Harold Dean and Adams Doris Ann
Create a Home Valuation Report for This Property
The Home Valuation Report is an in-depth analysis detailing your home's value as well as a comparison with similar homes in the area
Home Values in the Area
Average Home Value in this Area
Purchase History
| Date | Buyer | Sale Price | Title Company |
|---|---|---|---|
| Adams Doris Ann | -- | First American Title Company | |
| Adams Doris Ann | -- | First American Title Company | |
| Adams Harold Dean | -- | First American Title Company | |
| Adams Harold D | -- | First American Title Company | |
| Adams Harold Dean | -- | None Available |
Source: Public Records
Mortgage History
| Date | Status | Borrower | Loan Amount |
|---|---|---|---|
| Closed | Adams Doris Ann | $60,000 | |
| Closed | Adams Harold D | $40,000 |
Source: Public Records
Tax History Compared to Growth
Tax History
| Year | Tax Paid | Tax Assessment Tax Assessment Total Assessment is a certain percentage of the fair market value that is determined by local assessors to be the total taxable value of land and additions on the property. | Land | Improvement |
|---|---|---|---|---|
| 2025 | $1,684 | $101,267 | $24,222 | $77,045 |
| 2023 | $1,684 | $97,337 | $23,283 | $74,054 |
| 2022 | $1,595 | $95,429 | $22,827 | $72,602 |
| 2021 | $1,491 | $93,559 | $22,380 | $71,179 |
| 2020 | $1,458 | $92,601 | $22,151 | $70,450 |
| 2019 | $1,434 | $90,786 | $21,717 | $69,069 |
| 2018 | $1,401 | $89,007 | $21,292 | $67,715 |
| 2017 | $885 | $87,263 | $20,875 | $66,388 |
| 2016 | $859 | $85,553 | $20,466 | $65,087 |
| 2015 | $834 | $84,269 | $20,159 | $64,110 |
| 2014 | $817 | $82,620 | $19,765 | $62,855 |
Source: Public Records
Map
Nearby Homes
- 2981 Alta St
- 2481 Jonata St
- 2975 Alta St
- 2984 San Marcos Ave
- 2980 San Marcos Ave
- 2467 Jonata St
- 2964 San Marcos Ave
- 2451 Jonata St
- 2949 Alta St
- 2501 Railway Ave
- 2978 Alta St
- 2948 San Marcos Ave
- 2948 San Marcos Ave Unit 201
- 2948 San Marcos Ave Unit 102
- 2948 San Marcos Ave Unit 203
- 2948 San Marcos Ave Unit 103
- 2948 San Marcos Ave Unit 101
- 2445 Jonata St
- 2945 Alta St
- 2938 San Marcos Ave