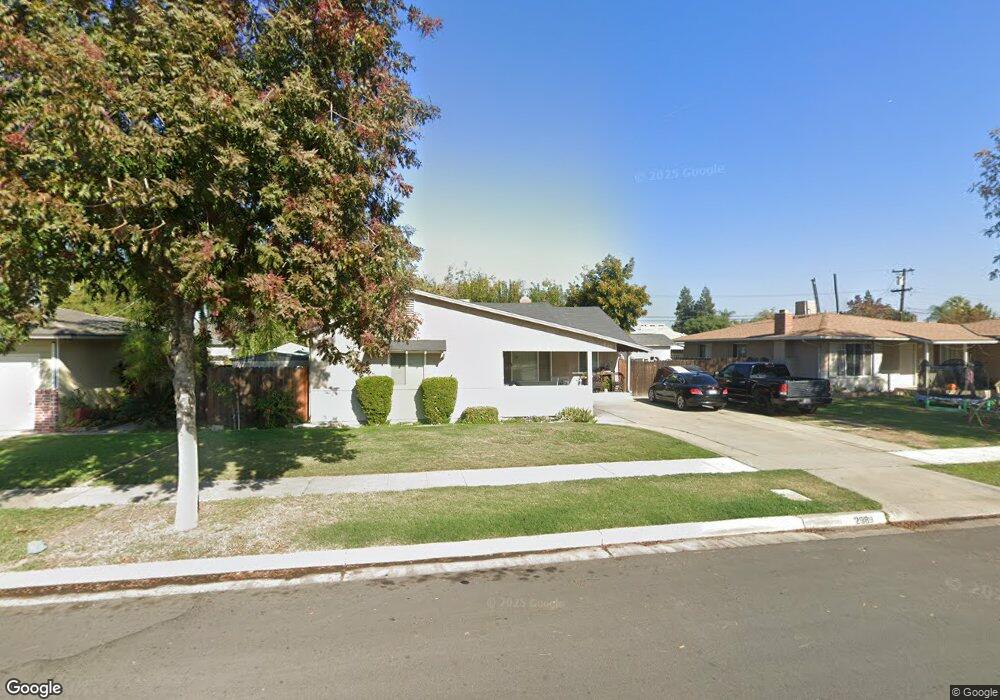
2989 E Swift Ave Fresno, CA 93726
Hoover NeighborhoodEstimated Value: $319,000 - $343,000
3
Beds
2
Baths
1,707
Sq Ft
$192/Sq Ft
Est. Value
About This Home
This home is located at 2989 E Swift Ave, Fresno, CA 93726 and is currently estimated at $328,589, approximately $192 per square foot. 2989 E Swift Ave is a home located in Fresno County with nearby schools including Pyle Elementary School, Tioga Middle School, and Herbert Hoover High School.
Ownership History
Date
Name
Owned For
Owner Type
Purchase Details
Closed on
Dec 2, 2003
Sold by
Gonzales Claudia
Bought by
Gonzales Michael J
Current Estimated Value
Home Financials for this Owner
Home Financials are based on the most recent Mortgage that was taken out on this home.
Original Mortgage
$102,600
Outstanding Balance
$47,301
Interest Rate
5.92%
Mortgage Type
Purchase Money Mortgage
Estimated Equity
$281,288
Purchase Details
Closed on
Nov 5, 2003
Sold by
Arthur Gary P and Arthur Esther R
Bought by
Gonzales Michael J
Home Financials for this Owner
Home Financials are based on the most recent Mortgage that was taken out on this home.
Original Mortgage
$102,600
Outstanding Balance
$47,301
Interest Rate
5.92%
Mortgage Type
Purchase Money Mortgage
Estimated Equity
$281,288
Purchase Details
Closed on
Sep 24, 2001
Sold by
Grisham Diane A and Daniels Diane A
Bought by
Arthur Gary P and Arthur Esther R
Home Financials for this Owner
Home Financials are based on the most recent Mortgage that was taken out on this home.
Original Mortgage
$85,500
Interest Rate
6.88%
Create a Home Valuation Report for This Property
The Home Valuation Report is an in-depth analysis detailing your home's value as well as a comparison with similar homes in the area
Home Values in the Area
Average Home Value in this Area
Purchase History
| Date | Buyer | Sale Price | Title Company |
|---|---|---|---|
| Gonzales Michael J | -- | North American Title Co Inc | |
| Gonzales Michael J | $108,000 | North American Title Co Inc | |
| Arthur Gary P | $95,000 | Financial Title Company | |
| Grisham Diane A | -- | Financial Title Company |
Source: Public Records
Mortgage History
| Date | Status | Borrower | Loan Amount |
|---|---|---|---|
| Open | Gonzales Michael J | $102,600 | |
| Previous Owner | Arthur Gary P | $85,500 |
Source: Public Records
Tax History Compared to Growth
Tax History
| Year | Tax Paid | Tax Assessment Tax Assessment Total Assessment is a certain percentage of the fair market value that is determined by local assessors to be the total taxable value of land and additions on the property. | Land | Improvement |
|---|---|---|---|---|
| 2025 | $2,117 | $161,738 | $35,536 | $126,202 |
| 2023 | $1,998 | $155,459 | $34,157 | $121,302 |
| 2022 | $1,971 | $152,412 | $33,488 | $118,924 |
| 2021 | $1,917 | $149,425 | $32,832 | $116,593 |
| 2020 | $1,732 | $134,000 | $29,300 | $104,700 |
| 2019 | $1,613 | $127,100 | $27,800 | $99,300 |
| 2018 | $1,580 | $124,700 | $27,300 | $97,400 |
| 2017 | $1,484 | $116,700 | $25,600 | $91,100 |
| 2016 | $1,396 | $111,200 | $24,400 | $86,800 |
| 2015 | $1,260 | $100,200 | $22,000 | $78,200 |
| 2014 | $1,184 | $93,900 | $20,600 | $73,300 |
Source: Public Records
Map
Nearby Homes
- 2999 E Richert Ave
- 2972 E Northdale Ave
- 2733 E Willis Ave
- 2817 E Indianapolis Ave
- 2542 E Ashcroft Ave
- 4326 N Fresno St
- 2719 E Norwich Ave
- 4005 N 1st St
- 2407 Ashcroft Ct
- 4259 N 4th St
- 3413 E Ashlan Ave
- 2333 E Austin Way
- 3214 E Griffith Way
- 4653 N Fisher St
- 4136 N Thesta St Unit 36
- 4136 N Thesta St
- 4136 N Thesta St Unit 31
- 2316 E Norwich Ave
- 2316 E Hampton Way
- 2918 E Santa Ana Ave
- 2997 E Swift Ave
- 2977 E Swift Ave
- 2988 E Richert Ave
- 2976 E Richert Ave
- 2998 E Richert Ave
- 3005 E Swift Ave
- 2965 E Swift Ave
- 2988 E Swift Ave
- 2964 E Richert Ave
- 2996 E Swift Ave
- 2978 E Swift Ave
- 3017 E Swift Ave
- 2953 E Swift Ave
- 3006 E Swift Ave
- 2966 E Swift Ave
- 2952 E Richert Ave
- 3016 E Richert Ave
- 2985 E Willis Ave
- 2987 E Richert Ave
- 3018 E Swift Ave