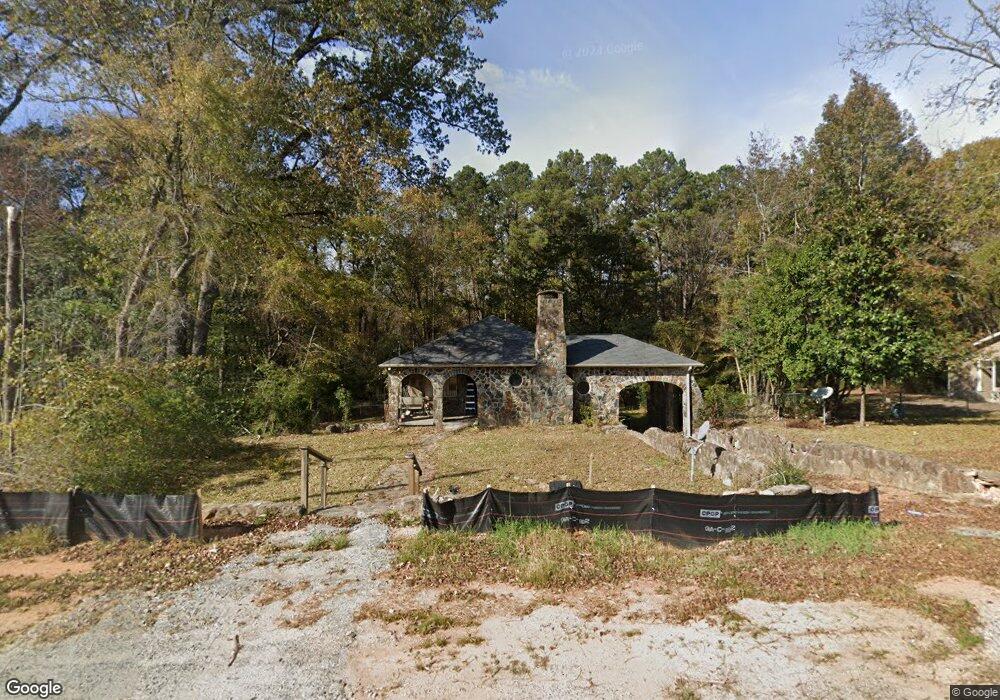
2989 Us Highway 27 Cataula, GA 31804
Cataula NeighborhoodEstimated Value: $158,676 - $219,000
2
Beds
1
Bath
1,200
Sq Ft
$158/Sq Ft
Est. Value
About This Home
This home is located at 2989 Us Highway 27, Cataula, GA 31804 and is currently estimated at $189,419, approximately $157 per square foot. 2989 Us Highway 27 is a home located in Harris County with nearby schools including Mulberry Creek Elementary School, Creekside School, and Harris County Carver Middle School.
Ownership History
Date
Name
Owned For
Owner Type
Purchase Details
Closed on
Jun 20, 2008
Sold by
Owens Kenneth E
Bought by
Williams Shari K
Current Estimated Value
Home Financials for this Owner
Home Financials are based on the most recent Mortgage that was taken out on this home.
Original Mortgage
$96,522
Outstanding Balance
$61,111
Interest Rate
5.96%
Mortgage Type
New Conventional
Estimated Equity
$128,308
Purchase Details
Closed on
Jun 15, 2005
Sold by
Hardeman Zola Marie Epting
Bought by
Owens Kenneth E
Home Financials for this Owner
Home Financials are based on the most recent Mortgage that was taken out on this home.
Original Mortgage
$60,000
Interest Rate
5.63%
Mortgage Type
New Conventional
Purchase Details
Closed on
May 6, 2004
Sold by
Hardeman John E
Bought by
Hardeman Zola Marie Epting
Purchase Details
Closed on
Jan 30, 1996
Bought by
Hardeman John E and Hardeman Marie E
Create a Home Valuation Report for This Property
The Home Valuation Report is an in-depth analysis detailing your home's value as well as a comparison with similar homes in the area
Home Values in the Area
Average Home Value in this Area
Purchase History
| Date | Buyer | Sale Price | Title Company |
|---|---|---|---|
| Williams Shari K | $97,285 | -- | |
| Owens Kenneth E | $75,000 | -- | |
| Hardeman Zola Marie Epting | -- | -- | |
| Hardeman John E | $57,000 | -- |
Source: Public Records
Mortgage History
| Date | Status | Borrower | Loan Amount |
|---|---|---|---|
| Open | Williams Shari K | $96,522 | |
| Previous Owner | Owens Kenneth E | $60,000 | |
| Previous Owner | Owens Kenneth E | $15,000 |
Source: Public Records
Tax History
| Year | Tax Paid | Tax Assessment Tax Assessment Total Assessment is a certain percentage of the fair market value that is determined by local assessors to be the total taxable value of land and additions on the property. | Land | Improvement |
|---|---|---|---|---|
| 2025 | $1,178 | $43,696 | $4,584 | $39,112 |
| 2024 | $1,103 | $39,655 | $5,060 | $34,595 |
| 2023 | $644 | $39,771 | $5,124 | $34,647 |
| 2022 | $1,106 | $39,771 | $5,124 | $34,647 |
| 2021 | $1,082 | $37,621 | $5,124 | $32,497 |
| 2020 | $1,082 | $37,621 | $5,124 | $32,497 |
| 2019 | $1,045 | $37,621 | $5,124 | $32,497 |
| 2018 | $1,066 | $37,621 | $5,124 | $32,497 |
| 2017 | $1,066 | $37,621 | $5,124 | $32,497 |
| 2016 | $986 | $37,782 | $5,124 | $32,658 |
| 2015 | $988 | $37,782 | $5,124 | $32,658 |
| 2014 | $990 | $37,782 | $5,124 | $32,658 |
| 2013 | -- | $37,782 | $5,124 | $32,658 |
Source: Public Records
Map
Nearby Homes
- 492 Mulberry Crossing Dr
- 909 Red Fox Ct
- 476 Wildwood Plantation Dr
- 111 E Bon Acre Rd
- 79 Acorn Ct
- 169 Cotton Ln
- 0 Kennon Dr Unit 1
- 218 E East Bonacre Rd
- 13145 Ga Highway 315
- 509 Sweetwater Dr
- 303 Waterford Dr
- 508 Sweetwater Dr
- 1278 Jones Rd
- 111 Shadewood Dr
- 139 Shadewood Dr
- 249 Serenity Loop
- 654 Grey Rock Rd
- 395 Walker Rd
- 0 Walker Rd
- 226.04 Ac Kingsboro Rd
- 3015 Us Highway 27
- 3029 Us Highway 27
- 81.18 Us Highway 27
- 81.18 Us Hwy 27
- 115 Holland Rd
- 1.72 Us Highway 27
- 1.72 Us Hwy 27
- 2980 Us Highway 27
- 3060 Us Highway 27
- 3080 Us Highway 27
- 2845 Us Highway 27
- 3114 Us Highway 27
- 64 Holland Rd
- 70 Holland Rd
- 165 Holland Rd
- 3136 Us Highway 27
- 199 Holland Rd
- 24 Knowles Rd
- 105 Knowles Rd
- 123 Knowles Rd
Your Personal Tour Guide
Ask me questions while you tour the home.