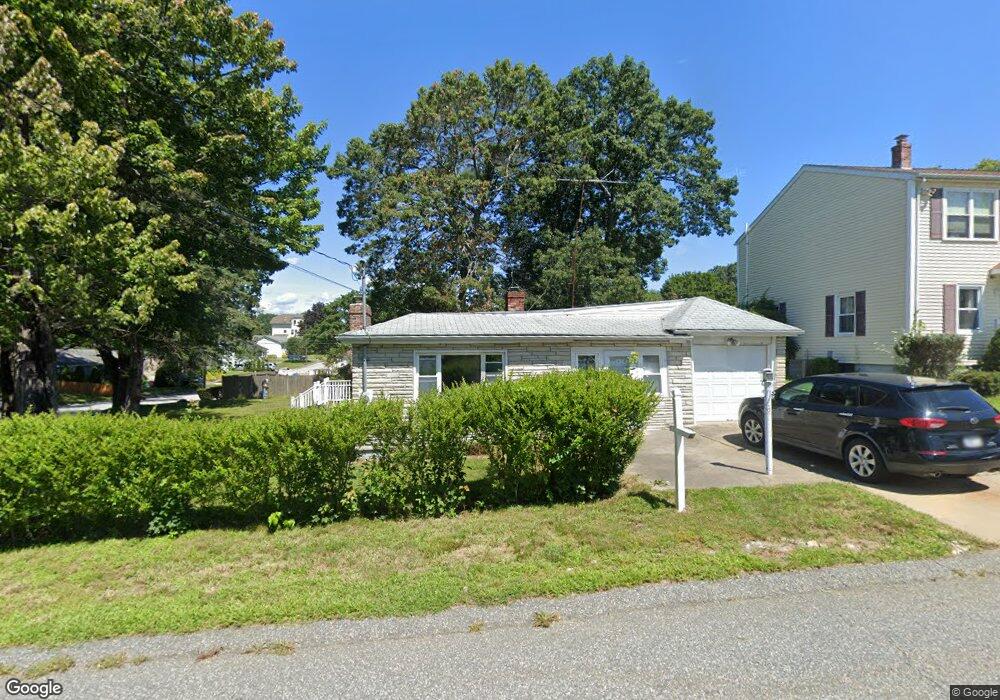
299 Larch St Woonsocket, RI 02895
East Woonsocket NeighborhoodEstimated Value: $294,000 - $358,000
1
Bed
1
Bath
867
Sq Ft
$372/Sq Ft
Est. Value
About This Home
This home is located at 299 Larch St, Woonsocket, RI 02895 and is currently estimated at $322,175, approximately $371 per square foot. 299 Larch St is a home located in Providence County with nearby schools including Woonsocket High School, Blackstone Valley Prep Element, and Blackstone Valley Prep High School.
Ownership History
Date
Name
Owned For
Owner Type
Purchase Details
Closed on
May 28, 2004
Sold by
Marini Theresa J and Nichols Albert
Bought by
Calkins Catherine E
Current Estimated Value
Home Financials for this Owner
Home Financials are based on the most recent Mortgage that was taken out on this home.
Original Mortgage
$109,600
Interest Rate
5.88%
Mortgage Type
Purchase Money Mortgage
Create a Home Valuation Report for This Property
The Home Valuation Report is an in-depth analysis detailing your home's value as well as a comparison with similar homes in the area
Home Values in the Area
Average Home Value in this Area
Purchase History
| Date | Buyer | Sale Price | Title Company |
|---|---|---|---|
| Calkins Catherine E | $137,000 | -- | |
| Calkins Catherine E | $137,000 | -- |
Source: Public Records
Mortgage History
| Date | Status | Borrower | Loan Amount |
|---|---|---|---|
| Open | Calkins Catherine E | $142,400 | |
| Closed | Calkins Catherine E | $109,600 | |
| Closed | Calkins Catherine E | $27,400 |
Source: Public Records
Tax History
| Year | Tax Paid | Tax Assessment Tax Assessment Total Assessment is a certain percentage of the fair market value that is determined by local assessors to be the total taxable value of land and additions on the property. | Land | Improvement |
|---|---|---|---|---|
| 2025 | $3,107 | $276,700 | $107,900 | $168,800 |
| 2024 | $2,646 | $182,000 | $88,000 | $94,000 |
| 2023 | $2,544 | $182,000 | $88,000 | $94,000 |
| 2022 | $2,544 | $182,000 | $88,000 | $94,000 |
| 2021 | $3,116 | $131,200 | $70,700 | $60,500 |
| 2020 | $3,149 | $131,200 | $70,700 | $60,500 |
| 2018 | $3,159 | $131,200 | $70,700 | $60,500 |
| 2017 | $3,380 | $112,300 | $65,300 | $47,000 |
| 2016 | $3,576 | $112,300 | $65,300 | $47,000 |
| 2015 | $4,108 | $112,300 | $65,300 | $47,000 |
| 2014 | $4,158 | $115,700 | $71,900 | $43,800 |
Source: Public Records
Map
Nearby Homes
- 202 Phillips St
- 39 Louise St
- 374 Thibeault Ave
- 378 Gauthier Dr
- 216 Bertenshaw Rd
- 42 Armand Ave
- 49 Poisson St
- 3 Quail St
- 414 Rhode Island Ave
- 3889 Mendon Rd
- 252 Railroad St
- 0 Hillview St
- 19 Marques St
- 45 Valley View Dr
- 375 Congress St
- 86 Branch Ave
- 253 Central St
- 0 Irving Lot 206 Ave Unit 1397321
- 59 Cooper Ave
- 1 Bouvier Ave
- 279 Larch St
- 280 Burrington St
- 260 Burrington St
- 241 Louise St
- 259 Larch St
- 205 Louise St
- 280 Larch St
- 238 Burrington St
- 286 Louise St
- 275 Burrington St
- 264 Larch St
- 237 Larch St
- 187 Louise St
- 291 Louise St
- 239 Burrington St
- 173 Louise St
- 216 Burrington St
- 264 Phillips St
- 242 Phillips St
- 219 Larch St
Your Personal Tour Guide
Ask me questions while you tour the home.