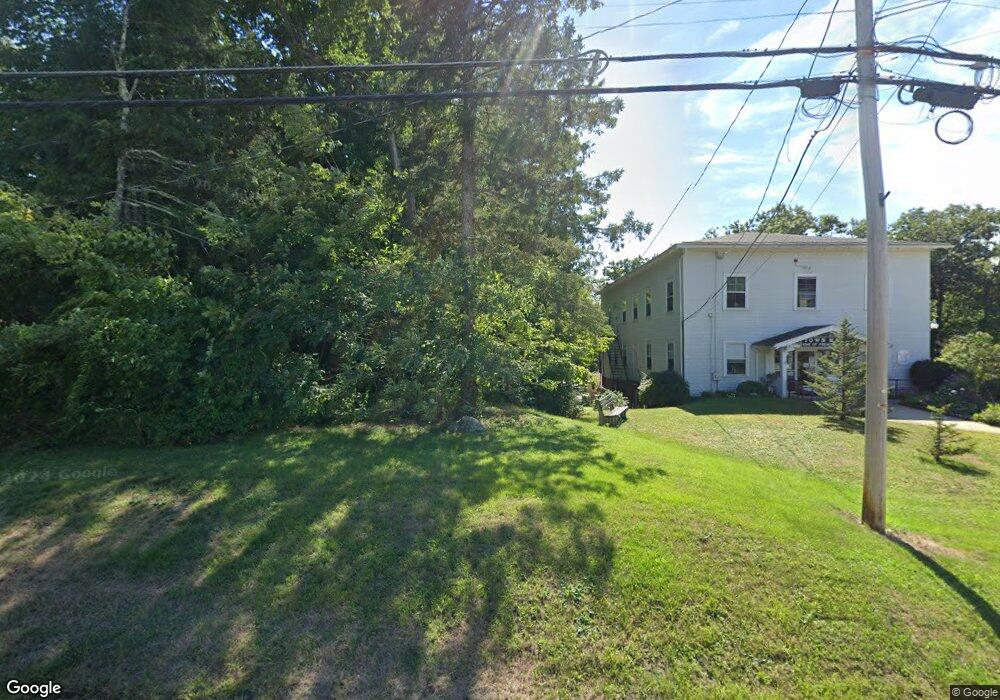
299 Main St Fremont, NH 03044
Estimated Value: $388,000 - $445,000
3
Beds
1
Bath
1,158
Sq Ft
$350/Sq Ft
Est. Value
About This Home
This home is located at 299 Main St, Fremont, NH 03044 and is currently estimated at $405,196, approximately $349 per square foot. 299 Main St is a home located in Rockingham County with nearby schools including Ellis School.
Ownership History
Date
Name
Owned For
Owner Type
Purchase Details
Closed on
Jul 3, 2008
Sold by
Moore Eric M and Moore Aris D
Bought by
Robinson Joan A and Martin Hollis D
Current Estimated Value
Home Financials for this Owner
Home Financials are based on the most recent Mortgage that was taken out on this home.
Original Mortgage
$150,000
Interest Rate
6.01%
Mortgage Type
Purchase Money Mortgage
Purchase Details
Closed on
Jun 8, 1998
Sold by
Wright Bruce C and Wright Catherine A
Bought by
Mcgrade William F and Mcgrade Paula A
Home Financials for this Owner
Home Financials are based on the most recent Mortgage that was taken out on this home.
Original Mortgage
$89,000
Interest Rate
7.05%
Create a Home Valuation Report for This Property
The Home Valuation Report is an in-depth analysis detailing your home's value as well as a comparison with similar homes in the area
Home Values in the Area
Average Home Value in this Area
Purchase History
| Date | Buyer | Sale Price | Title Company |
|---|---|---|---|
| Robinson Joan A | $230,000 | -- | |
| Mcgrade William F | $92,900 | -- |
Source: Public Records
Mortgage History
| Date | Status | Borrower | Loan Amount |
|---|---|---|---|
| Open | Mcgrade William F | $147,000 | |
| Closed | Mcgrade William F | $150,000 | |
| Previous Owner | Mcgrade William F | $89,000 |
Source: Public Records
Tax History Compared to Growth
Tax History
| Year | Tax Paid | Tax Assessment Tax Assessment Total Assessment is a certain percentage of the fair market value that is determined by local assessors to be the total taxable value of land and additions on the property. | Land | Improvement |
|---|---|---|---|---|
| 2024 | $5,651 | $214,300 | $74,100 | $140,200 |
| 2023 | $5,055 | $214,300 | $74,100 | $140,200 |
| 2022 | $4,970 | $214,300 | $74,100 | $140,200 |
| 2021 | $4,783 | $214,300 | $74,100 | $140,200 |
| 2020 | $0 | $214,300 | $74,100 | $140,200 |
| 2019 | $5,540 | $205,800 | $83,000 | $122,800 |
| 2018 | $5,936 | $205,800 | $83,000 | $122,800 |
| 2017 | $4,966 | $205,800 | $83,000 | $122,800 |
| 2016 | $6,149 | $205,800 | $83,000 | $122,800 |
| 2015 | $5,968 | $205,800 | $83,000 | $122,800 |
| 2014 | $5,554 | $196,800 | $94,100 | $102,700 |
| 2013 | $5,639 | $197,800 | $94,100 | $103,700 |
Source: Public Records
Map
Nearby Homes
- 308 Main St
- 240 Main St
- 45 Whittier Dr
- 164 Hall Rd
- 54 Cavil Mill Rd
- 188 Main St
- 38 Bluefish Dr
- 454 Main St
- 94 Thunder Rd
- 32 Country Ln
- Lot 7-0 Sanborn Meadow Unit 7-0
- Lot 7-3 Sanborn Meadow Unit 7-3
- 564 Main St
- Lot 7-2 Sanborn Meadow Unit 7-2
- 118 Hall Rd Unit 3
- 21 Jennifer Ln
- 3 Margaret Ave
- 13 Huckleberry Rd
- 11 Mary Ave
- 6 Mildred Ave