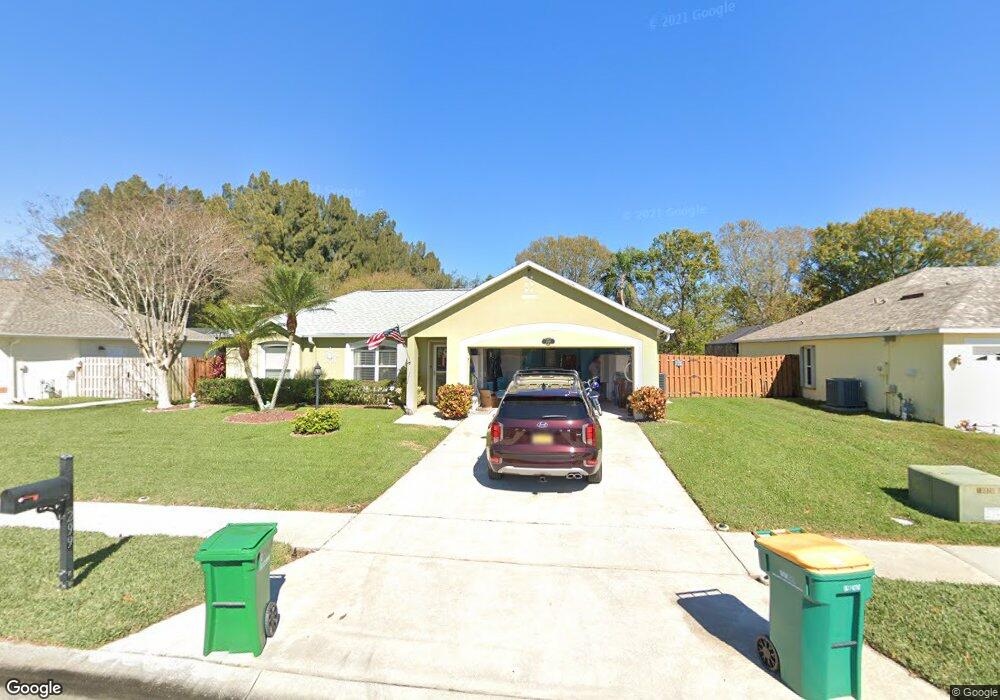
299 Mcclain Dr Melbourne, FL 32904
Estimated Value: $313,000 - $412,000
3
Beds
2
Baths
1,438
Sq Ft
$253/Sq Ft
Est. Value
About This Home
This home is located at 299 Mcclain Dr, Melbourne, FL 32904 and is currently estimated at $363,772, approximately $252 per square foot. 299 Mcclain Dr is a home located in Brevard County with nearby schools including University Park Elementary School, Central Middle School, and Melbourne Senior High School.
Ownership History
Date
Name
Owned For
Owner Type
Purchase Details
Closed on
Jul 29, 2016
Sold by
White Dielle
Bought by
Seiders Marlin D and Seiders Denise
Current Estimated Value
Purchase Details
Closed on
Mar 28, 2004
Sold by
Allen Dielle Becker
Bought by
Becker Dielle
Purchase Details
Closed on
Jul 12, 2000
Sold by
Maronda Homes Inc Fl
Bought by
Allen Dielle Becker
Home Financials for this Owner
Home Financials are based on the most recent Mortgage that was taken out on this home.
Original Mortgage
$93,000
Interest Rate
8.54%
Purchase Details
Closed on
Oct 15, 1999
Sold by
Westwoods Dev Corp Inc
Bought by
Maronda Homes Inc
Create a Home Valuation Report for This Property
The Home Valuation Report is an in-depth analysis detailing your home's value as well as a comparison with similar homes in the area
Home Values in the Area
Average Home Value in this Area
Purchase History
| Date | Buyer | Sale Price | Title Company |
|---|---|---|---|
| Seiders Marlin D | $230,000 | North American Title Co | |
| Becker Dielle | -- | -- | |
| Allen Dielle Becker | $99,500 | -- | |
| Maronda Homes Inc | $226,300 | -- |
Source: Public Records
Mortgage History
| Date | Status | Borrower | Loan Amount |
|---|---|---|---|
| Previous Owner | Allen Dielle Becker | $93,000 |
Source: Public Records
Tax History
| Year | Tax Paid | Tax Assessment Tax Assessment Total Assessment is a certain percentage of the fair market value that is determined by local assessors to be the total taxable value of land and additions on the property. | Land | Improvement |
|---|---|---|---|---|
| 2025 | $4,224 | $306,130 | -- | -- |
| 2024 | $4,114 | $314,700 | -- | -- |
| 2023 | $4,114 | $312,260 | $0 | $0 |
| 2022 | $3,598 | $280,050 | $0 | $0 |
| 2021 | $3,358 | $214,250 | $50,000 | $164,250 |
| 2020 | $3,143 | $197,400 | $40,000 | $157,400 |
| 2019 | $3,232 | $197,120 | $40,000 | $157,120 |
| 2018 | $3,246 | $192,920 | $40,000 | $152,920 |
| 2017 | $3,111 | $180,750 | $37,500 | $143,250 |
| 2016 | $1,577 | $119,210 | $25,000 | $94,210 |
| 2015 | $1,616 | $118,390 | $25,000 | $93,390 |
| 2014 | $1,614 | $117,450 | $25,000 | $92,450 |
Source: Public Records
Map
Nearby Homes
- 283 Murano Dr
- 244 Murano Dr
- 215 Mcclain Dr
- 263 Mcclain Dr
- 255 Sirius Ct
- 249 Mcclain Dr
- 4500 Gail Blvd
- 3804 Gail Blvd
- 525 Kimberly Cir
- 562 Ruth Cir
- 566 Marnie Cir
- 509 Susan Dr
- 46 Piney Branch Way Unit B
- 5120 Martin Ln
- 544 Jennifer Cir
- 520 Lee Ct
- 653 Brockton Way
- 522 Jean Cir
- 89 NW Irwin Ave
- 501 Parker Rd
Your Personal Tour Guide
Ask me questions while you tour the home.