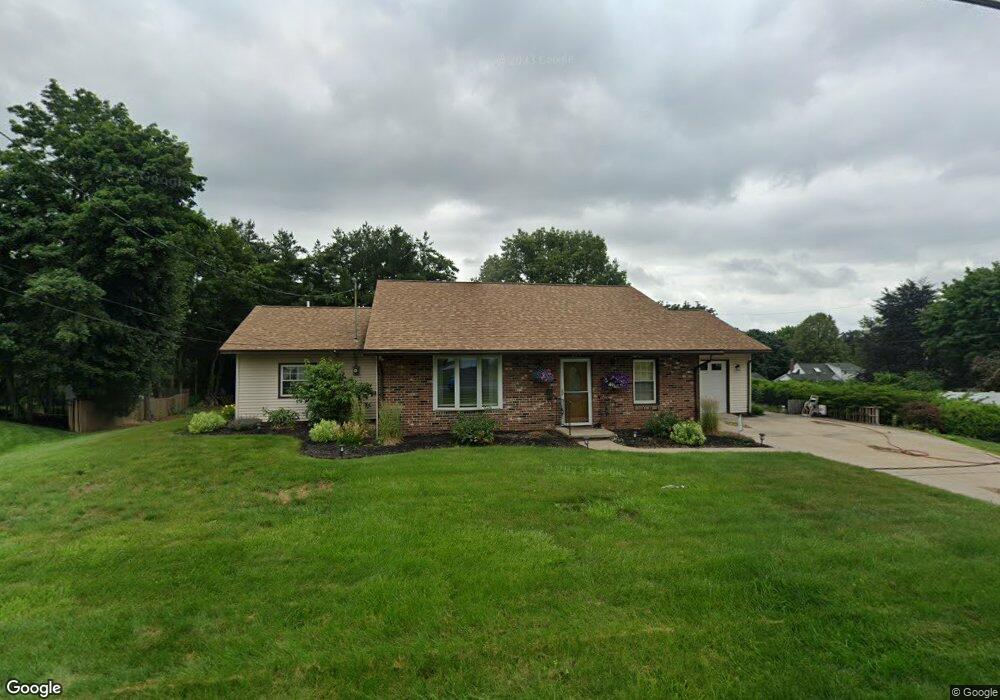
299 N Main St South Hadley, MA 01075
Estimated Value: $346,000 - $363,556
3
Beds
3
Baths
1,248
Sq Ft
$282/Sq Ft
Est. Value
About This Home
This home is located at 299 N Main St, South Hadley, MA 01075 and is currently estimated at $352,185, approximately $282 per square foot. 299 N Main St is a home located in Hampshire County with nearby schools including Plains Elementary School, Mosier Elementary School, and Michael E. Smith Middle School.
Ownership History
Date
Name
Owned For
Owner Type
Purchase Details
Closed on
Jan 17, 2019
Sold by
Fugler Leo E
Bought by
Fernandes Ryan C and Walsh Jillian A
Current Estimated Value
Home Financials for this Owner
Home Financials are based on the most recent Mortgage that was taken out on this home.
Original Mortgage
$220,000
Outstanding Balance
$193,816
Interest Rate
4.7%
Mortgage Type
New Conventional
Estimated Equity
$158,369
Purchase Details
Closed on
Apr 7, 1983
Bought by
Fugler Leo E
Create a Home Valuation Report for This Property
The Home Valuation Report is an in-depth analysis detailing your home's value as well as a comparison with similar homes in the area
Home Values in the Area
Average Home Value in this Area
Purchase History
| Date | Buyer | Sale Price | Title Company |
|---|---|---|---|
| Fernandes Ryan C | $230,000 | None Available | |
| Fugler Leo E | $38,500 | -- |
Source: Public Records
Mortgage History
| Date | Status | Borrower | Loan Amount |
|---|---|---|---|
| Open | Fernandes Ryan C | $220,000 |
Source: Public Records
Tax History Compared to Growth
Tax History
| Year | Tax Paid | Tax Assessment Tax Assessment Total Assessment is a certain percentage of the fair market value that is determined by local assessors to be the total taxable value of land and additions on the property. | Land | Improvement |
|---|---|---|---|---|
| 2025 | $4,508 | $283,000 | $118,400 | $164,600 |
| 2024 | $4,660 | $279,900 | $110,600 | $169,300 |
| 2023 | $4,282 | $244,000 | $100,200 | $143,800 |
| 2022 | $4,127 | $223,300 | $100,200 | $123,100 |
| 2021 | $4,057 | $208,500 | $93,500 | $115,000 |
| 2020 | $3,998 | $200,500 | $93,500 | $107,000 |
| 2019 | $3,843 | $190,700 | $89,000 | $101,700 |
| 2018 | $3,693 | $185,300 | $86,300 | $99,000 |
| 2017 | $3,581 | $178,000 | $86,300 | $91,700 |
| 2016 | $3,591 | $180,900 | $86,300 | $94,600 |
| 2015 | $3,403 | $175,600 | $83,800 | $91,800 |
Source: Public Records
Map
Nearby Homes
- 47 Pynchon Rd
- 84 Judd Ave
- 1 White Brook Ln
- 70 Lathrop St
- 41 W Summit St Unit 72
- 41 W Summit St Unit 54
- 41 W Summit St Unit 32
- 41 W Summit St Unit 55
- 85 Fairview St
- 318 Newton St
- 88 Alvord St
- 49 N Main St
- 7 Hunter Terrace
- 17 Cleveland St
- 4 Sunrise Cir
- 60 San Souci Dr
- 27 Bardwell St Unit 4
- 10 Radcliffe St
- 45 Pine St
- 211 Pleasant St