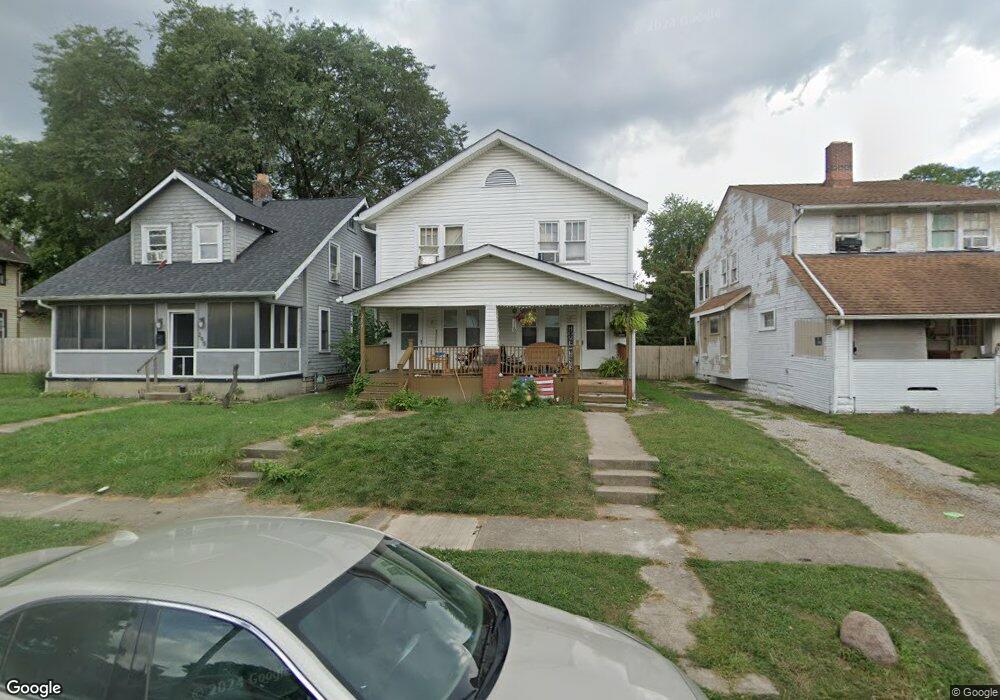
299 N Ogden Ave Unit 3 Columbus, OH 43204
North Hilltop NeighborhoodEstimated Value: $179,000 - $215,000
6
Beds
2
Baths
2,352
Sq Ft
$82/Sq Ft
Est. Value
About This Home
This home is located at 299 N Ogden Ave Unit 3, Columbus, OH 43204 and is currently estimated at $193,724, approximately $82 per square foot. 299 N Ogden Ave Unit 3 is a home located in Franklin County with nearby schools including West Broad Elementary School, Westmoor Middle School, and West High School.
Ownership History
Date
Name
Owned For
Owner Type
Purchase Details
Closed on
Oct 27, 2022
Sold by
Adkins Amy M
Bought by
Modali Apoorva and Concessao Nixon
Current Estimated Value
Home Financials for this Owner
Home Financials are based on the most recent Mortgage that was taken out on this home.
Original Mortgage
$124,125
Outstanding Balance
$120,269
Interest Rate
6.94%
Mortgage Type
Credit Line Revolving
Estimated Equity
$73,455
Purchase Details
Closed on
Oct 3, 2019
Sold by
Kashey And Associates Lady Jane Ave Llc
Bought by
Adkins Amy M
Purchase Details
Closed on
Dec 5, 2006
Sold by
Jcm Properties Ltd
Bought by
Mills Jennifer
Purchase Details
Closed on
May 19, 2004
Sold by
Mills Jennifer and Stephen Mills M
Bought by
Jcm Properties Ltd
Purchase Details
Closed on
May 30, 2003
Sold by
Hughes Billy J
Bought by
Mills Jennifer
Purchase Details
Closed on
Aug 12, 1988
Create a Home Valuation Report for This Property
The Home Valuation Report is an in-depth analysis detailing your home's value as well as a comparison with similar homes in the area
Home Values in the Area
Average Home Value in this Area
Purchase History
| Date | Buyer | Sale Price | Title Company |
|---|---|---|---|
| Modali Apoorva | $165,500 | Pm Title | |
| Adkins Amy M | $113,900 | None Available | |
| Mills Jennifer | -- | Valley | |
| Jcm Properties Ltd | -- | -- | |
| Mills Jennifer | $87,000 | Chelsea Title Agency | |
| -- | -- | -- |
Source: Public Records
Mortgage History
| Date | Status | Borrower | Loan Amount |
|---|---|---|---|
| Open | Modali Apoorva | $124,125 |
Source: Public Records
Tax History Compared to Growth
Tax History
| Year | Tax Paid | Tax Assessment Tax Assessment Total Assessment is a certain percentage of the fair market value that is determined by local assessors to be the total taxable value of land and additions on the property. | Land | Improvement |
|---|---|---|---|---|
| 2024 | $2,281 | $50,300 | $5,150 | $45,150 |
| 2023 | $2,402 | $50,295 | $5,145 | $45,150 |
| 2022 | $1,351 | $25,420 | $2,910 | $22,510 |
| 2021 | $1,353 | $25,420 | $2,910 | $22,510 |
| 2020 | $1,355 | $25,420 | $2,910 | $22,510 |
| 2019 | $1,317 | $21,180 | $2,420 | $18,760 |
| 2018 | $1,320 | $21,180 | $2,420 | $18,760 |
| 2017 | $1,386 | $21,180 | $2,420 | $18,760 |
| 2016 | $1,456 | $21,430 | $3,890 | $17,540 |
| 2015 | $1,325 | $21,430 | $3,890 | $17,540 |
| 2014 | $1,329 | $21,430 | $3,890 | $17,540 |
| 2013 | $770 | $25,165 | $4,550 | $20,615 |
Source: Public Records
Map
Nearby Homes
- 298 N Burgess Ave
- 200-202 N Harris Ave
- 166 N Harris Ave
- 2578 Elliott Ave
- 127 N Burgess Ave
- 118 N Ogden Ave
- 104-106 N Hague Ave
- 87 N Warren Ave
- 78 N Burgess Ave
- 285 N Wayne Ave
- 75 N Terrace Ave
- 149 N Eureka Ave
- 188 N Eureka Ave
- 274 N Wayne Ave
- 2360 Westwood Dr
- 184 N Roys Ave
- 162 S Roys Ave
- 120 N Eureka Ave Unit 122
- 527 N Hague Ave
- 146 N Wayne Ave
- 299 N Ogden Ave Unit 301
- 299-301 N Ogden Ave
- 299 & 301 N Ogden Ave
- 307 N Ogden Ave Unit 307
- 295 N Ogden Ave
- 291 N Ogden Ave
- 311 N Ogden Ave
- 317 N Ogden Ave
- 287 N Ogden Ave
- 321 N Ogden Ave
- 281 N Ogden Ave
- 298 N Warren Ave
- 304 N Warren Ave
- 292 N Warren Ave Unit 294
- 308 N Warren Ave
- 288 N Warren Ave
- 308-310 N Ogden Ave
- 325 N Ogden Ave
- 304 N Ogden Ave
- 312 N Warren Ave