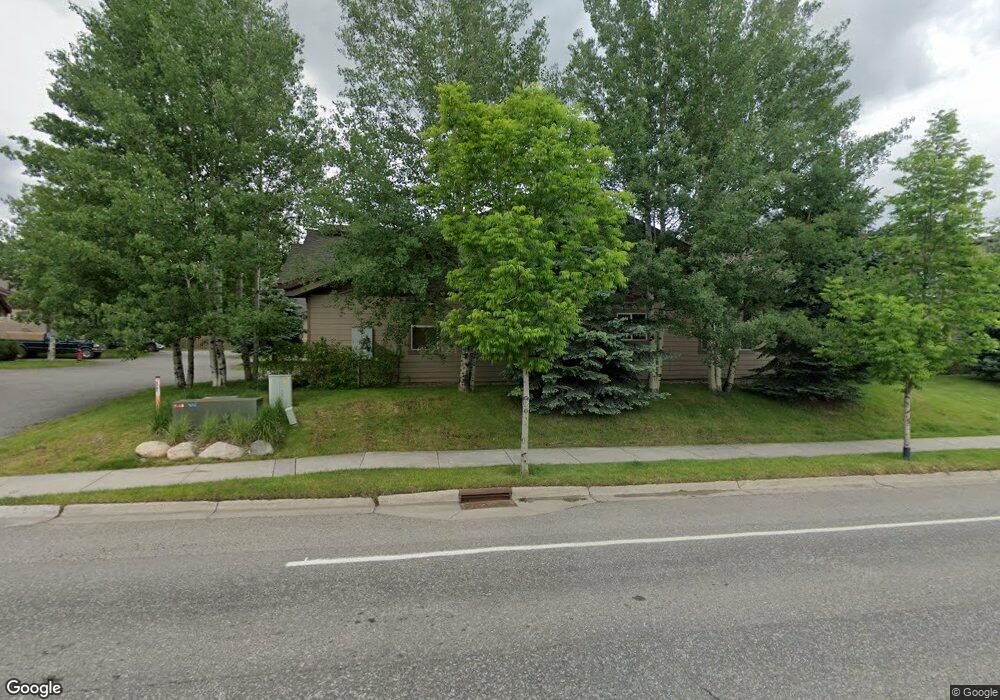
299 Ousel Falls Rd Unit 8 Big Sky, MT 59716
Estimated Value: $1,061,000 - $1,359,000
3
Beds
3
Baths
1,769
Sq Ft
$670/Sq Ft
Est. Value
About This Home
This home is located at 299 Ousel Falls Rd Unit 8, Big Sky, MT 59716 and is currently estimated at $1,184,734, approximately $669 per square foot. 299 Ousel Falls Rd Unit 8 is a home located in Gallatin County with nearby schools including Ophir Elementary School, Ophir Junior High School, and Lone Peak High School.
Ownership History
Date
Name
Owned For
Owner Type
Purchase Details
Closed on
Nov 30, 2020
Sold by
Johnson Andrew D and Johnson Tetyana
Bought by
Glynn John
Current Estimated Value
Home Financials for this Owner
Home Financials are based on the most recent Mortgage that was taken out on this home.
Original Mortgage
$534,400
Outstanding Balance
$475,091
Interest Rate
2.62%
Mortgage Type
New Conventional
Estimated Equity
$709,643
Purchase Details
Closed on
May 17, 2017
Sold by
Radtke Carrie A and Radtke Charles J
Bought by
Johnson Andrew D and Johnson Tetyana
Home Financials for this Owner
Home Financials are based on the most recent Mortgage that was taken out on this home.
Original Mortgage
$394,250
Interest Rate
4.1%
Mortgage Type
New Conventional
Purchase Details
Closed on
Jan 16, 2015
Sold by
Schwalbe James and Schwalbe Lois A
Bought by
Radtke Carrie A and Radtke Charles J
Home Financials for this Owner
Home Financials are based on the most recent Mortgage that was taken out on this home.
Original Mortgage
$260,000
Interest Rate
3.82%
Mortgage Type
New Conventional
Create a Home Valuation Report for This Property
The Home Valuation Report is an in-depth analysis detailing your home's value as well as a comparison with similar homes in the area
Home Values in the Area
Average Home Value in this Area
Purchase History
| Date | Buyer | Sale Price | Title Company |
|---|---|---|---|
| Glynn John | -- | First American Title Company | |
| Johnson Andrew D | -- | First American Title Company | |
| Radtke Carrie A | -- | American Land Title Company |
Source: Public Records
Mortgage History
| Date | Status | Borrower | Loan Amount |
|---|---|---|---|
| Open | Glynn John | $534,400 | |
| Previous Owner | Johnson Andrew D | $394,250 | |
| Previous Owner | Radtke Carrie A | $260,000 |
Source: Public Records
Tax History
| Year | Tax Paid | Tax Assessment Tax Assessment Total Assessment is a certain percentage of the fair market value that is determined by local assessors to be the total taxable value of land and additions on the property. | Land | Improvement |
|---|---|---|---|---|
| 2025 | $4,885 | $1,475,800 | $0 | $0 |
| 2024 | $4,000 | $908,600 | $0 | $0 |
| 2023 | $4,220 | $944,800 | $0 | $0 |
| 2022 | $3,676 | $562,400 | $0 | $0 |
| 2021 | $3,585 | $562,400 | $0 | $0 |
| 2020 | $2,976 | $416,500 | $0 | $0 |
| 2019 | $2,747 | $416,500 | $0 | $0 |
| 2018 | $2,390 | $328,200 | $0 | $0 |
| 2017 | $2,280 | $328,200 | $0 | $0 |
| 2016 | $2,083 | $246,400 | $0 | $0 |
| 2015 | $2,065 | $246,400 | $0 | $0 |
| 2014 | $2,621 | $200,446 | $0 | $0 |
Source: Public Records
Map
Nearby Homes
- 15 Salmon Fly Dr Unit 12
- 167 Pheasant Tail Ln Unit B
- 22 Limber Pine Place Unit 16
- 54 Marmot Ln
- 313 Spruce Cone Dr
- 85 Spruce Cone Unit 10
- 34 Stream Side Way
- 40 Brook Trout Place
- 30 Whitefish Dr
- Lot 16 Upper Whitefish Dr
- Lot 20 Upper Whitefish Dr
- Lot 4 Upper Whitefish Dr
- Lot 19 Upper Whitefish Dr
- Lot 5 Upper Whitefish Dr
- Lot 3 Upper Whitefish Dr
- 430 Spruce Cone Dr
- 49 Bear Trap Ln
- Lot 3 Cutthroat Trout Place
- 99 Town Center Avenue Unit R2 Ave
- 99 Town Center Ave
- 299 Ousel Falls Rd Unit 5
- 299 Ousel Falls Rd Unit 22
- 299 Ousel Falls Rd
- 299 Ousel Falls Rd Unit 16
- 299 Ousel Falls Rd Unit 18
- 299 Ousel Falls Rd
- 299 Ousel Falls Rd Unit 13
- 299 Ousel Falls Rd Unit 28
- 299 Ousel Falls Rd Unit 2 Tamarack
- 299 Ousel Falls Rd Unit 21
- 299 Ousel Falls Rd
- 299 Ousel Falls Rd
- 299 Ousel Falls Rd Unit 9
- 299 Ousel Falls Rd Unit 10
- 299 Ousel Falls Rd Unit 29
- 299 Ousel Falls Rd Unit 3
- 299 Ousel Falls Rd Unit 25
- 500 Rainbow Trout Run
- 7 Rainbow Trout Run
- 438 Rainbow Trout Run
Your Personal Tour Guide
Ask me questions while you tour the home.