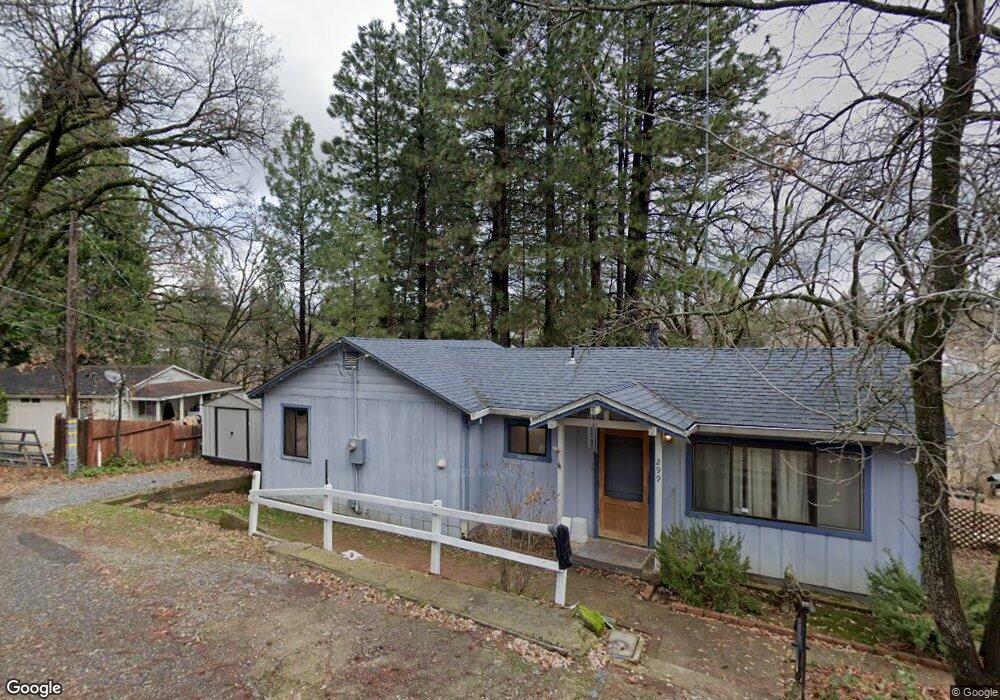
299 Pinecone Ln West Point, CA 95255
Estimated Value: $159,000 - $202,000
2
Beds
2
Baths
1,088
Sq Ft
$171/Sq Ft
Est. Value
About This Home
This home is located at 299 Pinecone Ln, West Point, CA 95255 and is currently estimated at $185,808, approximately $170 per square foot. 299 Pinecone Ln is a home located in Calaveras County with nearby schools including Pioneer Magnet School for the Visual & Performing Arts, Jackson Junior High School, and Amador High School.
Ownership History
Date
Name
Owned For
Owner Type
Purchase Details
Closed on
Jan 2, 2021
Sold by
Fikes David and Fikes Vicci
Bought by
Smith Scott Royal and 299 Pinecone Lane Trust
Current Estimated Value
Purchase Details
Closed on
Jan 17, 2014
Sold by
Fikes David and Fikes Vicci
Bought by
Fikes 2006 Revocable Trust
Purchase Details
Closed on
Dec 17, 2013
Sold by
Federal National Mortgage Association
Bought by
Fikes David and Fikes Vicci
Purchase Details
Closed on
Jun 24, 2013
Sold by
Keiser Denise Louise
Bought by
Federal National Mortgage Association
Purchase Details
Closed on
Jan 21, 2005
Sold by
Magee Michael R and Magee Anne Christine
Bought by
Keiser Denise Louise
Home Financials for this Owner
Home Financials are based on the most recent Mortgage that was taken out on this home.
Original Mortgage
$129,520
Interest Rate
6.63%
Mortgage Type
Purchase Money Mortgage
Create a Home Valuation Report for This Property
The Home Valuation Report is an in-depth analysis detailing your home's value as well as a comparison with similar homes in the area
Purchase History
| Date | Buyer | Sale Price | Title Company |
|---|---|---|---|
| Smith Scott Royal | -- | None Available | |
| Fikes 2006 Revocable Trust | -- | Accommodation | |
| Fikes David | $60,000 | Calaveras Title Company | |
| Federal National Mortgage Association | $170,526 | Accommodation | |
| Keiser Denise Louise | $162,000 | First American Title Company |
Source: Public Records
Mortgage History
| Date | Status | Borrower | Loan Amount |
|---|---|---|---|
| Previous Owner | Keiser Denise Louise | $129,520 | |
| Closed | Keiser Denise Louise | $32,380 |
Source: Public Records
Tax History
| Year | Tax Paid | Tax Assessment Tax Assessment Total Assessment is a certain percentage of the fair market value that is determined by local assessors to be the total taxable value of land and additions on the property. | Land | Improvement |
|---|---|---|---|---|
| 2025 | $1,342 | $73,540 | $24,511 | $49,029 |
| 2023 | $1,326 | $70,686 | $23,560 | $47,126 |
| 2022 | $1,215 | $69,301 | $23,099 | $46,202 |
| 2021 | $1,149 | $67,944 | $22,647 | $45,297 |
| 2020 | $983 | $67,248 | $22,415 | $44,833 |
| 2019 | $1,010 | $65,930 | $21,976 | $43,954 |
| 2018 | $975 | $64,639 | $21,546 | $43,093 |
| 2017 | $959 | $63,373 | $21,124 | $42,249 |
| 2016 | $959 | $62,131 | $20,710 | $41,421 |
| 2015 | -- | $61,198 | $20,399 | $40,799 |
| 2014 | -- | $60,000 | $20,000 | $40,000 |
Source: Public Records
Map
Nearby Homes
- 329 Pinecone Ln
- 219 Smith Ln
- 901 Bald Mountain Rd
- 250 Acorn Way
- 398 Rhoda Niderost Ln
- 23555 Highway 26
- 201 Barney Way
- 955 Grinding Rock Ct
- 33 Stanley Rd
- 21785 State Route 26
- 5050 June Ave
- 1392 Palmer Rd
- 2323 Spink Rd
- 979 Dorothy Way
- 850 Barbara Ln
- 75 Sandy Gulch Ln
- 148 Sandy Gulch Ln
- 4220 Tree Ln
- 402 Rabbits Foot Rd
- 0 Quartz Mountain Rd Unit 225101074
- 285 Pine Cone Ln
- 311 Pinecone Ln
- 311 Pinecone Ln Unit 335
- 286 Pinecone Ln
- 304 Pine Cone Ln
- 304 Pinecone Ln
- 251 Cemetery Ln
- 328 Pinecone Ln
- 335 Pinecone Ln
- 335 Pinecone Ln Unit 311
- 335 Pinecone Ln Unit 331
- 277 Cemetery Ln
- 277 Main St
- 263 Main St
- 260 Cemetery Ln
- 174 Spink Rd
- 299 Main St
- 266 Spink Rd
- 311 Main St
- 317 Main St
Your Personal Tour Guide
Ask me questions while you tour the home.