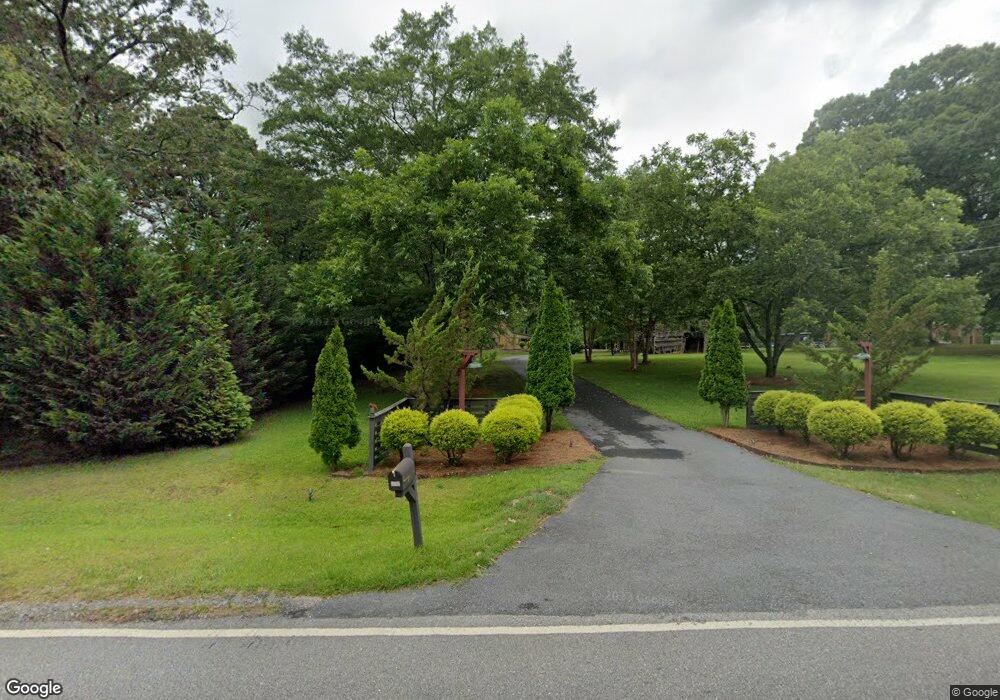
299 Punkin Junction Rd Bethlehem, GA 30620
Estimated Value: $334,000 - $348,000
3
Beds
3
Baths
1,962
Sq Ft
$173/Sq Ft
Est. Value
About This Home
This home is located at 299 Punkin Junction Rd, Bethlehem, GA 30620 and is currently estimated at $339,632, approximately $173 per square foot. 299 Punkin Junction Rd is a home located in Barrow County with nearby schools including Kennedy Elementary School, Westside Middle School, and Apalachee High School.
Ownership History
Date
Name
Owned For
Owner Type
Purchase Details
Closed on
Sep 10, 2025
Sold by
Feltman Russell H
Bought by
Feltman Russell H and Williams Elvis Tracy
Current Estimated Value
Purchase Details
Closed on
Mar 9, 2012
Sold by
Feltman Nancy
Bought by
Feltman Rueesll H and Williams Elvis Tracy
Home Financials for this Owner
Home Financials are based on the most recent Mortgage that was taken out on this home.
Original Mortgage
$94,400
Interest Rate
3.89%
Mortgage Type
New Conventional
Purchase Details
Closed on
Feb 16, 2012
Sold by
Feltman Nancy
Bought by
Loftin Judy H and Loftin Robert L
Home Financials for this Owner
Home Financials are based on the most recent Mortgage that was taken out on this home.
Original Mortgage
$94,400
Interest Rate
3.89%
Mortgage Type
New Conventional
Purchase Details
Closed on
Oct 23, 2000
Sold by
Feltman Nancy
Bought by
Feltman Nancy and Feltman Terry A
Purchase Details
Closed on
Aug 24, 1998
Sold by
Loftin Judy and Loftin Robert
Bought by
Hill Willie C
Create a Home Valuation Report for This Property
The Home Valuation Report is an in-depth analysis detailing your home's value as well as a comparison with similar homes in the area
Home Values in the Area
Average Home Value in this Area
Purchase History
| Date | Buyer | Sale Price | Title Company |
|---|---|---|---|
| Feltman Russell H | -- | -- | |
| Feltman Rueesll H | $100,000 | -- | |
| Loftin Judy H | -- | -- | |
| Feltman Nancy | -- | -- | |
| Hill Willie C | -- | -- |
Source: Public Records
Mortgage History
| Date | Status | Borrower | Loan Amount |
|---|---|---|---|
| Previous Owner | Feltman Rueesll H | $94,400 |
Source: Public Records
Tax History
| Year | Tax Paid | Tax Assessment Tax Assessment Total Assessment is a certain percentage of the fair market value that is determined by local assessors to be the total taxable value of land and additions on the property. | Land | Improvement |
|---|---|---|---|---|
| 2025 | $2,223 | $97,996 | $20,000 | $77,996 |
| 2024 | $2,247 | $93,970 | $18,000 | $75,970 |
| 2023 | $1,825 | $93,970 | $18,000 | $75,970 |
| 2022 | $1,695 | $62,101 | $14,212 | $47,889 |
| 2021 | $1,784 | $62,101 | $14,212 | $47,889 |
| 2020 | $1,786 | $62,101 | $14,212 | $47,889 |
| 2019 | $1,662 | $57,012 | $14,212 | $42,800 |
| 2018 | $1,638 | $57,012 | $14,212 | $42,800 |
| 2017 | $1,502 | $51,582 | $14,212 | $37,370 |
| 2016 | $1,443 | $51,582 | $14,212 | $37,370 |
| 2015 | $1,285 | $46,162 | $14,212 | $31,950 |
| 2014 | $1,123 | $40,494 | $6,964 | $33,530 |
| 2013 | -- | $38,177 | $6,964 | $31,213 |
Source: Public Records
Map
Nearby Homes
- 29 Arbor Way
- 106 Carterdale Ct Unit 1
- 99 Rivington Dr
- 102 Rivington Dr
- 106 Rivington Dr
- 108 Rivington Dr
- 110 Rivington Dr
- 112 Rivington Dr
- 236 Vision St
- 176 Market St
- 14 Smithwood Dr
- 59 Thetford Way
- 60 Thetford Way
- 29 Padley Dr
- 670 Loganville Hwy
- 0 Carson Wages Rd Unit 7617509
- 0 Carson Wages Rd Unit 10348307
- 297 Rydal Way
- Cosmos Plan at Rivington Walk
- 134 Dunedin Dr
- 289 Punkin Junction Rd
- 39 Arbor Point
- 79 Arbor Way Unit 3
- 59 Arbor Point
- 59 Arbor Point Unit 6
- 53 Arbor Way Unit 2
- 23 Arbor Point Unit 4
- 306 Hills Point Rd
- 292 Punkin Junction Rd
- 29 Arbor Way Unit 1
- 332 Hills Point Ct
- 301 Hills Point Rd
- 305 Hills Point Rd
- 334 Hills Point Ct
- 336 Hill's Pointe Ct
- 336 Hills Point Ct
- 12 Arbor Point Unit 10
- 76 Arbor Way
- 338 Hills Point Ct
- 54 Arbor Way
Your Personal Tour Guide
Ask me questions while you tour the home.