
Seller's Agent in 2013
Tami Pelletier
Pelletier Realty Group
(603) 494-2331
1 in this area
71 Total Sales
Estimated Value: $791,000 - $1,175,000
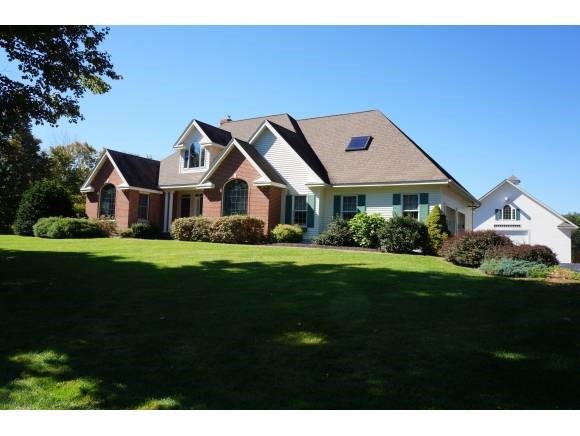
Enjoy Westerly Views in every Season from this updated & outstanding Ranch Style Home. Relax by the heated in ground pool, sunny decks and lower patio all new over the past 1-2yrs.3brms on 1st floor plus additional bonus room on 2nd floor over garage. The lower level has it all with a spacious office/conference room, exercise room and family room that opens to patio.First floor master bedroom suite with door to multiple decking, walk in closet; jacuzzi corner tub,his & her sinks & sep. shower. Formal dining room. Living room with built ins & fireplace with double doors to sun room.Fully applianced eat in kitchen with granite counters, table area with access to multiple decks overlooking pool & views. Take advantage of both the 3 car heated attached garage & the recently built metal interior 60X40' 16'HT versitile detached barn/garage. Central Air, Irrigation and security system. A Special property conveniently located to both Concord & Manchester.
Last Agent to Sell the Property
Pelletier Realty Group License #039195 Listed on: 09/30/2013
Last Buyer's Agent
Yvonne Siciliano
Pelletier Realty Group License #058787
| Date | Event | Price | List to Sale | Price per Sq Ft |
|---|---|---|---|---|
| 11/22/2013 11/22/13 | Sold | $419,000 | -3.9% | $168 / Sq Ft |
| 10/11/2013 10/11/13 | Pending | -- | -- | -- |
| 09/30/2013 09/30/13 | For Sale | $436,000 | -- | $174 / Sq Ft |
| Year | Tax Paid | Tax Assessment Tax Assessment Total Assessment is a certain percentage of the fair market value that is determined by local assessors to be the total taxable value of land and additions on the property. | Land | Improvement |
|---|---|---|---|---|
| 2024 | $13,467 | $510,500 | $79,300 | $431,200 |
| 2023 | $13,053 | $510,500 | $79,300 | $431,200 |
| 2022 | $11,731 | $510,500 | $79,300 | $431,200 |
| 2021 | $11,951 | $510,500 | $79,300 | $431,200 |
| 2020 | $11,374 | $510,500 | $79,300 | $431,200 |
| 2018 | $9,492 | $421,300 | $73,500 | $347,800 |
| 2017 | $10,789 | $421,300 | $73,500 | $347,800 |
| 2016 | $10,103 | $421,300 | $73,500 | $347,800 |
| 2015 | $9,938 | $421,300 | $73,500 | $347,800 |
| 2014 | $9,625 | $455,300 | $73,500 | $381,800 |
| 2013 | $9,566 | $455,300 | $73,500 | $381,800 |
Seller's Agent in 2013
Tami Pelletier
Pelletier Realty Group
(603) 494-2331
1 in this area
71 Total Sales
Y
Buyer's Agent in 2013
Yvonne Siciliano
Pelletier Realty Group
Source: PrimeMLS
MLS Number: 4318343
APN: DUNB-000004-000001-000001-B000000
Disclaimer: Certain information contained herein is derived from information provided by parties other than Homes.com. All information provided is deemed reliable, but is not guaranteed to be accurate and should be independently verified.
![]() Copyright 2025 PrimeMLS, Inc. All rights reserved. This information is deemed reliable, but not guaranteed. The data relating to real estate displayed on this display comes in part from the IDX Program of PrimeMLS. The information being provided is for consumers’ personal, non-commercial use and may not be used for any purpose other than to identify prospective properties consumers may be interested in purchasing.
Copyright 2025 PrimeMLS, Inc. All rights reserved. This information is deemed reliable, but not guaranteed. The data relating to real estate displayed on this display comes in part from the IDX Program of PrimeMLS. The information being provided is for consumers’ personal, non-commercial use and may not be used for any purpose other than to identify prospective properties consumers may be interested in purchasing.