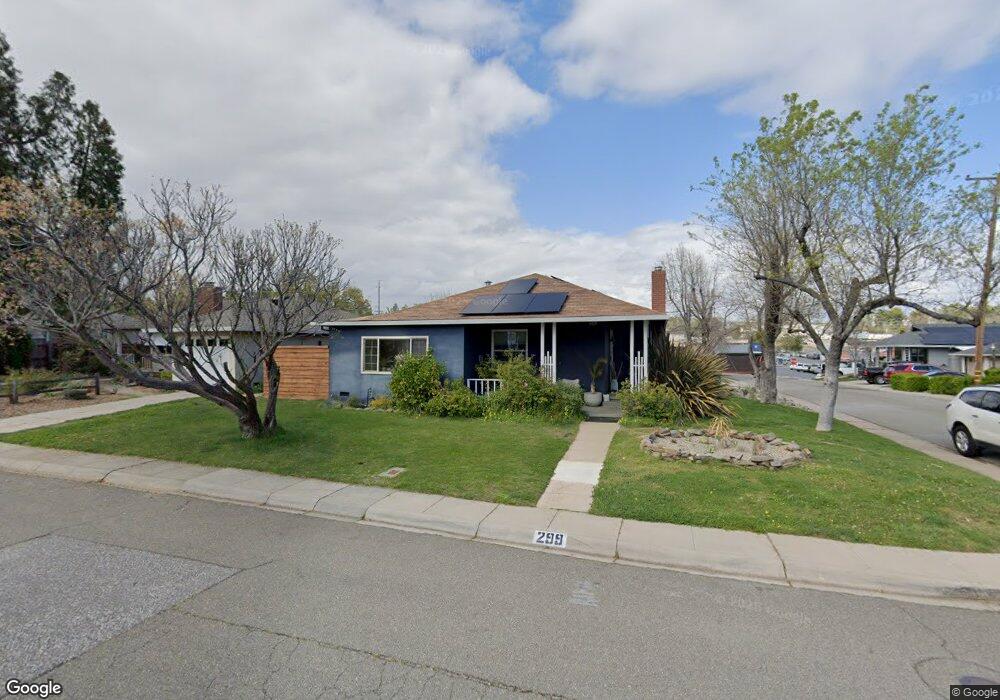
299 Sutter St Auburn, CA 95603
Estimated Value: $421,000 - $496,000
2
Beds
2
Baths
1,134
Sq Ft
$407/Sq Ft
Est. Value
About This Home
This home is located at 299 Sutter St, Auburn, CA 95603 and is currently estimated at $461,281, approximately $406 per square foot. 299 Sutter St is a home located in Placer County with nearby schools including Skyridge Elementary School, Placer High School, and Alta Vista Community Charter.
Ownership History
Date
Name
Owned For
Owner Type
Purchase Details
Closed on
Dec 23, 2020
Sold by
Arcularius James J and Arcularius Catriona M
Bought by
Arcularius Catriona
Current Estimated Value
Home Financials for this Owner
Home Financials are based on the most recent Mortgage that was taken out on this home.
Original Mortgage
$235,000
Outstanding Balance
$209,220
Interest Rate
2.7%
Mortgage Type
New Conventional
Estimated Equity
$252,061
Purchase Details
Closed on
May 15, 2017
Sold by
Arcularius James J and Arcularius Catriona M
Bought by
Arcularius James J and Arcularius Catriona M
Purchase Details
Closed on
Mar 15, 2002
Sold by
Chapman Judy A
Bought by
Arcularius James J and Arcularius Catriona M
Home Financials for this Owner
Home Financials are based on the most recent Mortgage that was taken out on this home.
Original Mortgage
$84,000
Interest Rate
6.85%
Mortgage Type
Purchase Money Mortgage
Purchase Details
Closed on
Dec 28, 1995
Sold by
Shenk Lyle F and Shenk Jean A
Bought by
Shenk Lyle F and Shenk Jean A
Create a Home Valuation Report for This Property
The Home Valuation Report is an in-depth analysis detailing your home's value as well as a comparison with similar homes in the area
Home Values in the Area
Average Home Value in this Area
Purchase History
| Date | Buyer | Sale Price | Title Company |
|---|---|---|---|
| Arcularius Catriona | -- | North American Title Co Inc | |
| Arcularius Catriona | -- | North American Title Co Inc | |
| Arcularius James J | -- | None Available | |
| Arcularius James J | $190,500 | North American Title Co | |
| Shenk Lyle F | -- | -- |
Source: Public Records
Mortgage History
| Date | Status | Borrower | Loan Amount |
|---|---|---|---|
| Open | Arcularius Catriona | $235,000 | |
| Closed | Arcularius James J | $84,000 |
Source: Public Records
Tax History
| Year | Tax Paid | Tax Assessment Tax Assessment Total Assessment is a certain percentage of the fair market value that is determined by local assessors to be the total taxable value of land and additions on the property. | Land | Improvement |
|---|---|---|---|---|
| 2025 | $3,868 | $281,254 | $118,172 | $163,082 |
| 2023 | $3,868 | $270,334 | $113,584 | $156,750 |
| 2022 | $3,823 | $265,034 | $111,357 | $153,677 |
| 2021 | $3,720 | $259,838 | $109,174 | $150,664 |
| 2020 | $3,700 | $257,175 | $108,055 | $149,120 |
| 2019 | $3,649 | $252,134 | $105,937 | $146,197 |
| 2018 | $3,503 | $247,191 | $103,860 | $143,331 |
| 2017 | $3,420 | $242,345 | $101,824 | $140,521 |
| 2016 | $3,332 | $237,594 | $99,828 | $137,766 |
| 2015 | $3,168 | $234,026 | $98,329 | $135,697 |
| 2014 | $2,981 | $218,007 | $91,598 | $126,409 |
Source: Public Records
Map
Nearby Homes
- 325 Union St
- 161 Summit St
- 34-35 Grass Valley Hwy
- 55 Neils
- 150 Center St
- 111 Electric St
- 121 Aeolia Dr
- 160 Walker Dr
- 811 Auburn Ravine Rd
- 163 Pleasant Ave
- 726 Dorothy Way Unit 48
- 734 Dorothy Way Unit 66
- 228 Foresthill Ave Unit B
- 232 Foresthill Ave Unit B
- 0 Dairy Rd Unit 225137062
- 330 Foresthill Ave
- 420 Miles Ct
- 681 Foresthill Ave
- 120 Darlington Ave
- 465 Miles Ct
- 291 Sutter St
- 281 Sutter St
- 170 Sterling Ave
- 264 Fulweiler Ave
- 180 Sterling Ave
- 160 Sterling Ave
- 271 Sutter St
- 280 Sutter St
- 190 Sterling Ave
- 256 Fulweiler Ave
- 261 Sutter St
- 270 Sutter St
- 248 Fulweiler Ave
- 260 Sutter St
- 251 Sutter St
- 240 Fulweiler Ave
- 250 Sutter St
- 241 Sutter St
- 285 Chana Dr
- 232 Fulweiler Ave
Your Personal Tour Guide
Ask me questions while you tour the home.