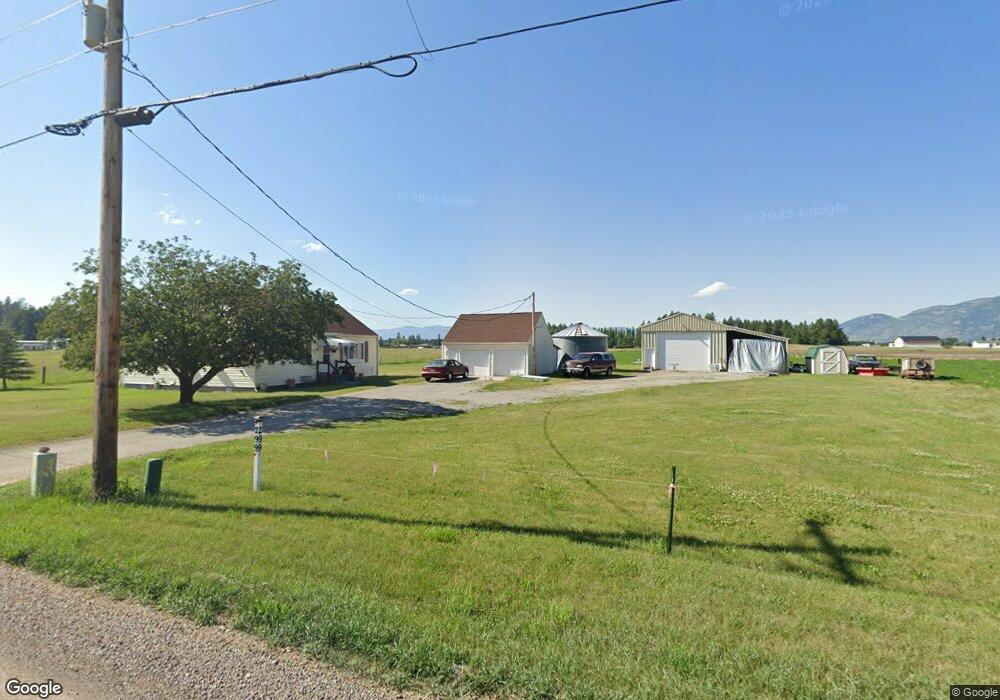
299 Trap Rd Columbia Falls, MT 59912
Estimated Value: $534,899 - $733,000
2
Beds
1
Bath
1,884
Sq Ft
$350/Sq Ft
Est. Value
About This Home
This home is located at 299 Trap Rd, Columbia Falls, MT 59912 and is currently estimated at $658,975, approximately $349 per square foot. 299 Trap Rd is a home located in Flathead County with nearby schools including Ruder Elementary School, Columbia Falls Junior High School (7-8), and Columbia Falls High School.
Ownership History
Date
Name
Owned For
Owner Type
Purchase Details
Closed on
Dec 11, 2015
Sold by
Burke Ruth
Bought by
Cheff James P and Cheff Kim L
Current Estimated Value
Purchase Details
Closed on
Apr 1, 2015
Sold by
Pulsifer Jean
Bought by
Boyle Dennis O and Boyle Cindy O
Purchase Details
Closed on
Aug 28, 2014
Sold by
Ridenour Glenn L
Bought by
Ridenour Glenn L and Ridenour Karen B
Purchase Details
Closed on
Oct 7, 2008
Sold by
Casterline Wilma Jean and Kettinger Ken
Bought by
Kettinger Ken
Create a Home Valuation Report for This Property
The Home Valuation Report is an in-depth analysis detailing your home's value as well as a comparison with similar homes in the area
Home Values in the Area
Average Home Value in this Area
Purchase History
| Date | Buyer | Sale Price | Title Company |
|---|---|---|---|
| Cheff James P | -- | None Available | |
| Burke Ruth | -- | First American Title Company | |
| Boyle Dennis O | -- | First American Title Company | |
| Ridenour Glenn L | -- | None Available | |
| Kettinger Ken | -- | None Available |
Source: Public Records
Tax History Compared to Growth
Tax History
| Year | Tax Paid | Tax Assessment Tax Assessment Total Assessment is a certain percentage of the fair market value that is determined by local assessors to be the total taxable value of land and additions on the property. | Land | Improvement |
|---|---|---|---|---|
| 2025 | $1,858 | $483,500 | $0 | $0 |
| 2024 | $2,557 | $413,300 | $0 | $0 |
| 2023 | $2,589 | $413,300 | $0 | $0 |
| 2022 | $2,251 | $271,500 | $0 | $0 |
| 2021 | $2,345 | $271,500 | $0 | $0 |
| 2020 | $2,039 | $226,100 | $0 | $0 |
| 2019 | $1,930 | $226,100 | $0 | $0 |
| 2018 | $1,763 | $198,400 | $0 | $0 |
| 2017 | $1,651 | $198,400 | $0 | $0 |
| 2016 | $1,415 | $125,667 | $0 | $0 |
| 2015 | $1,270 | $125,667 | $0 | $0 |
| 2014 | $1,032 | $71,015 | $0 | $0 |
Source: Public Records
Map
Nearby Homes
- Nhn Trap Rd
- 300 Jay Hawk Ln
- 474 Trap Rd
- 183 Middle View Trail
- 128 Back Forty View
- 154 Columbia Range Dr
- 2360 Montana Highway 206
- 271 Patriots Ln
- 2247 Montana Highway 206
- 255 Patriots Ln
- 147 Patriots Ln
- 240 Elk Park Rd
- 211 Patriots Ln
- 189 Patriots Ln
- 597 Eckelberry Dr
- 556 Windy Acres Dr
- 125 Greenwald Ln
- 109 Greenwald Ln
- 1955 Mt Highway 206
- 1930 Montana Highway 206