2990 Churn Creek Rd Redding, CA 96002
Estimated Value: $225,565
--
Bed
--
Bath
8,448
Sq Ft
$27/Sq Ft
Est. Value
About This Home
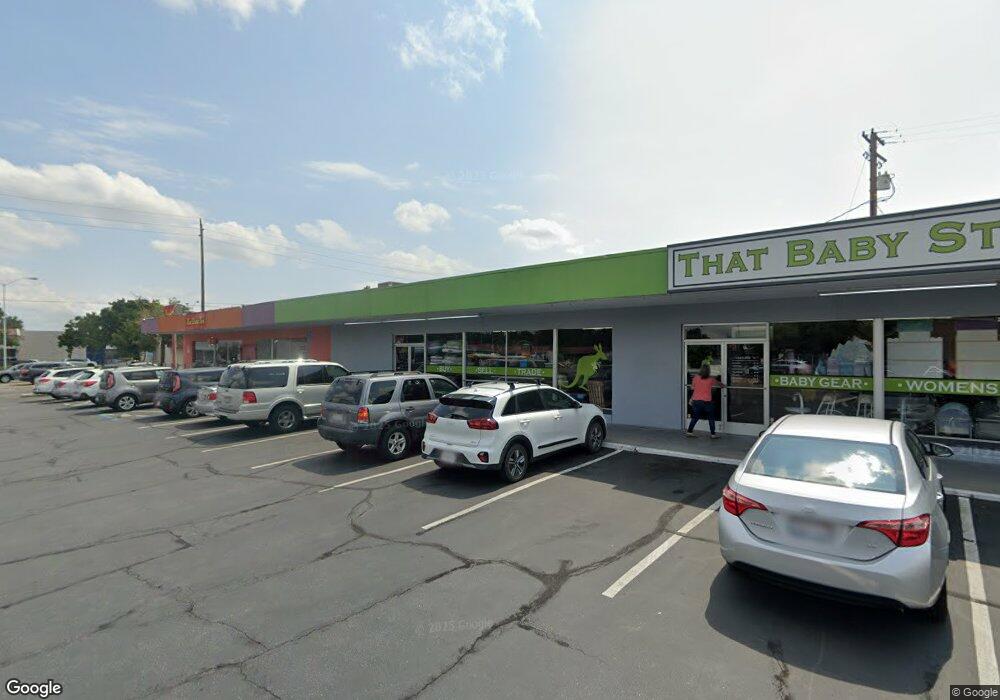
This home is located at 2990 Churn Creek Rd, Redding, CA 96002 and is currently estimated at $225,565, approximately $26 per square foot. 2990 Churn Creek Rd is a home located in Shasta County with nearby schools including Rother Elementary School, Parsons Junior High School, and Enterprise High School.
Ownership History
Date
Name
Owned For
Owner Type
Purchase Details
Closed on
Dec 14, 2010
Sold by
Powell Roberta G
Bought by
Powell Roberta G
Current Estimated Value
Create a Home Valuation Report for This Property
The Home Valuation Report is an in-depth analysis detailing your home's value as well as a comparison with similar homes in the area
Home Values in the Area
Average Home Value in this Area
Purchase History
| Date | Buyer | Sale Price | Title Company |
|---|---|---|---|
| Powell Roberta G | -- | None Available | |
| Powell Roberta G | -- | None Available |
Source: Public Records
Tax History Compared to Growth
Tax History
| Year | Tax Paid | Tax Assessment Tax Assessment Total Assessment is a certain percentage of the fair market value that is determined by local assessors to be the total taxable value of land and additions on the property. | Land | Improvement |
|---|---|---|---|---|
| 2025 | $2,908 | $1,100,000 | $200,000 | $900,000 |
| 2024 | $2,869 | $248,314 | $72,957 | $175,357 |
| 2023 | $2,869 | $243,446 | $71,527 | $171,919 |
| 2022 | $2,791 | $238,674 | $70,125 | $168,549 |
| 2021 | $2,701 | $233,995 | $68,750 | $165,245 |
| 2020 | $2,689 | $231,597 | $68,046 | $163,551 |
| 2019 | $2,669 | $227,057 | $66,712 | $160,345 |
| 2018 | $2,639 | $222,605 | $65,404 | $157,201 |
| 2017 | $2,683 | $218,241 | $64,122 | $154,119 |
| 2016 | $2,519 | $213,963 | $62,865 | $151,098 |
| 2015 | $2,499 | $210,750 | $61,921 | $148,829 |
| 2014 | $2,483 | $206,623 | $60,709 | $145,914 |
Source: Public Records
Map
Nearby Homes
- 0 Churn Creek Rd Unit 25-496
- 2919 Blueview St
- 2901 Blue View St
- 2953 Churn Ct
- 2915 Rockabye Ln
- 2786 Larkspur Ln
- 1221 E Cypress Ave Unit 67
- 3178 Lawrence Rd
- 2820 Alfreda Way
- 1091 Del Sol Place
- 1118 4th St
- 3428 Adams Ln
- 952 Camino Ct
- 953 Camino Ct
- 2810 Bechelli Ln
- 3527 Adams Ln
- 855 Jefferson Ct
- 1105 Layton Rd
- 3540 Ricardo Ave
- 3591 Adams Ln
- 2920 Churn Creek Rd
- 0 Churn Creek Rd Unit 15-2034
- 0 Churn Creek Rd Unit 17-1524
- 0 Churn Creek Rd Unit 10-1843
- 0 Churn Creek Rd Unit 8-4735
- 0 Churn Creek Rd Unit 5-1895
- 0 Churn Creek Rd Unit 4-1098
- 0 Churn Creek Rd Unit 5-1270
- 0 Churn Creek Rd Unit 2-99621
- 0 Churn Creek Rd Unit 3-103183
- 0 Churn Creek Rd Unit 3-100710
- 0 Churn Creek Rd Unit 2-99623
- 0 Churn Creek Rd Unit 2-99624
- 0 Churn Creek Rd Unit 99-75749
- 0 Churn Creek Rd Unit 97-66835
- 0 Churn Creek Rd Unit 24-1647
- 0 Churn Creek Rd Unit 94-42595
- 0 Churn Creek Rd Unit 97-68110
- 0 Churn Creek Rd Unit 99-79848
- 0 Churn Creek Rd Unit 85833